This post updates – and corrects – the data from October, which had some bad values for non-renewables prior to May 2016. This affected some of the trends (mostly large-scale hydro) reported then. Apologies for those errors.
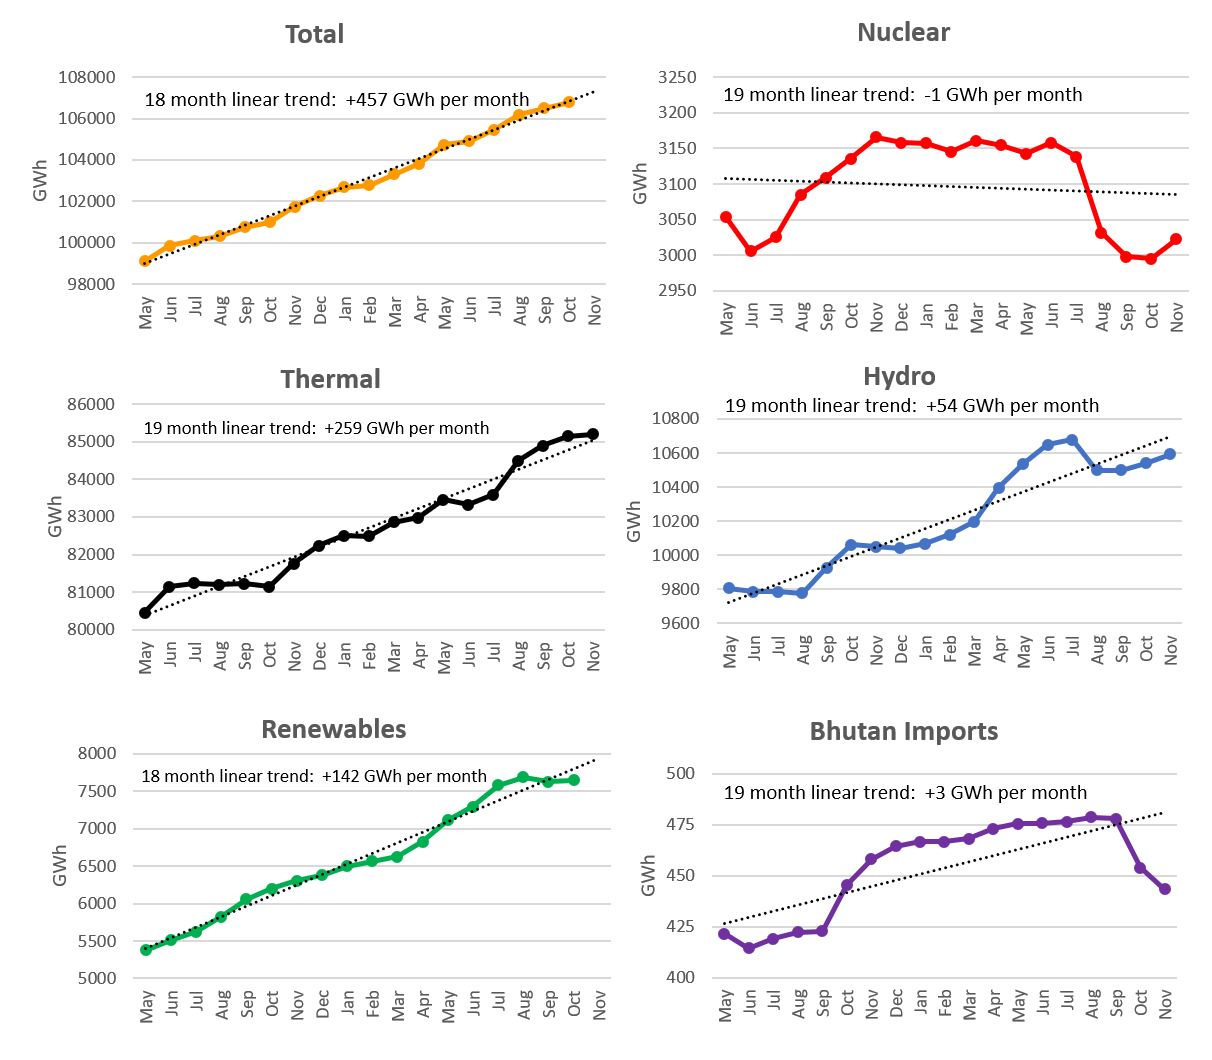
The latest 12 month averaged data shows a near linear increase in total generation over the 18 months until October (the November total cannot be calculated until renewable values are known), steadily rising thermal generation, a slight stalling in the rate of renewable increase (also still awaiting the November figure), modestly increasing hydro, and nuclear generation still stalled. Wind generation, which reached a record high of 21.3 GWh between July and September, slackened off considerably in September and October with low wind speeds. This can be seen in a simple way by looking at weather observations from towns near major wind-farm areas. For example, Kadur, not too far from the Acciona and Suzlon wind farms, had only 7 days with average wind speeds above 6 km/h this September, compared to 26 in 2016, and no days at all reaching 6km/h in October. Might this reflect the reported increased variability and intensity in the Indian monsoon?
The last 18 months worth of 12-month averaged data (so reflective of generation since June 2015) shows that additional thermal generation is contributing about 56% of each month’s increase, more renewable generation about 31%, and increased hydro about 12%. As new wind and especially new solar in the pipeline comes on-stream in the next couple of years, will it start to displace increases in coal? That will depend on several factors, a key one being whether the DISCOMS will be able to keep purchasing ever more power.


2 Trackbacks / Pingbacks