
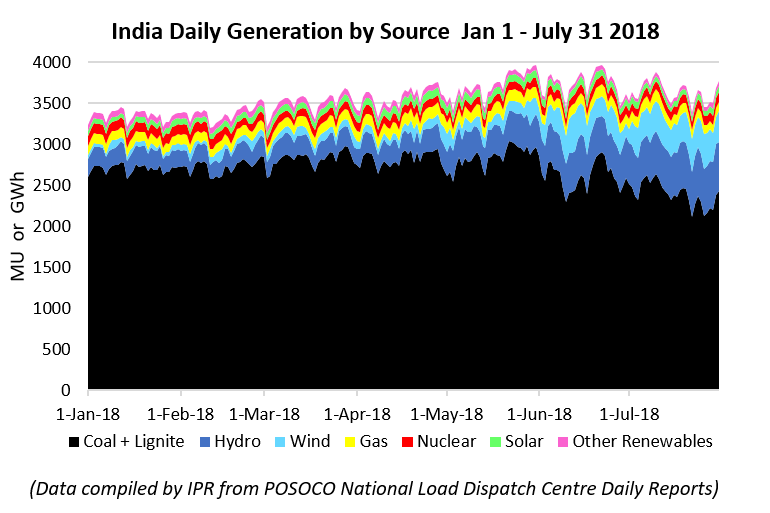
More than halfway through the calendar year and we update generation sources for the year to date. The following graphs show daily POSOCO data from seven sources: coal (and lignite), nuclear, gas, hydro, wind, solar and other renewables. This is slightly more fine-grained than CEA data and far more timely than the latter’s monthly reports, which have generally been delayed by about two months for renewable data but are now lagging several weeks for conventional generation values as well.
The first graph shows generation each day in GWh, the second as a percentage of the daily total, making its composition more readable. While the bulk of grid energy is still generated by coal, the graphs show the significant effect of seasonal weather. The average daily contribution of hydro and renewables has picked up with the monsoon’s arrival, reaching an average of 29.9% in the last two weeks and a peak so far of 32.1% on July 26th. This will settle back as the monsoon winds and rains recede, but approaching one-third of daily generation from renewable sources for even part of the year, long before peak renewable capacity has been rolled out, is a marker of India’s progress in renewable energy.


Be the first to comment