

(This is the first of a monthly analysis of a specific Indian energy transition topic that will generally be published in the third week of each month. This analysis will also be published by the Institute for Energy Economics & Financial Analysis (IEEFA) as a Briefing Note.)
Last year The Minerals Council of Australia (MCA) released its “Market Demand Study: Australian Export Thermal Coal” report1 (prepared by Commodity Insights), forecasting out to 2030 the thermal coal import requirements of nine individual Asian countries including China and India, and an “Other Asia” grouping comprising Pakistan, Bangladesh and Sri Lanka.
Of the twelve countries studied, the MCA report picks India as the largest growth market for seaborne thermal coal between the base year of 2016 and 2030, with a forecast growth of 131 million tons (Mt), an increase almost double that of the next country Vietnam, reaching an estimated 268Mt annual import requirement by the end of the study period.
India Power Review (IPR) examined the analyses, assumptions and input data used in the MCA study, and replicated the projections using the MCA report’s expectations for India’s electricity growth, but with more realistic assumptions for thermal coal’s future share of generation.
The projections were also repeated using five alternative, independent data-sets for Indian electricity growth to 2030 from India’s Central Electricity Authority Annual Report, India’s National Electricity Plan (NEP 2018), and the Brookings Institution (India).
The MCA’s own demand growth data, when modelled with a more realistic thermal generation share forecast, resulted in a virtually flat curve with no growth in imports across the study period.
Representing a critical key risk assessment for Australian thermal coal exports, all five alternative data sets resulted in lower total import requirements over the forecast period. The one closest to the MCA projection shared with it a structural upward bias but still suggests the MCA forecast over-estimates the import requirement by more than 100 Mt over the period. The remaining four indicate ever-larger decreases in imports relative to the MCA forecast as time progresses. One of these projections showed no import requirement after 2026, at a level more than 2 billion tons short of the MCA’s estimates over the forecast period.
This analysis outlines how the forecasts were determined, presents some of their limitations and strengths, and outlines factors which may account for the discrepancy between the MCA forecasts and these alternatives.
Reverse-engineering the Minerals Council of Australia 2018 report methods
The MCA report presents a short-term (up to 2022) and a long-term outlook (up to 2030), using essentially the same approach. For the former, projected Indian electricity demand and growth in domestic coal production are used, although little detail is provided about the specific method. It is unclear how or even whether the MCA use their tabulated data on anticipated thermal generation capacity increases.
Figure 1: MCA Report
vs. Actual Thermal Capacity Additions
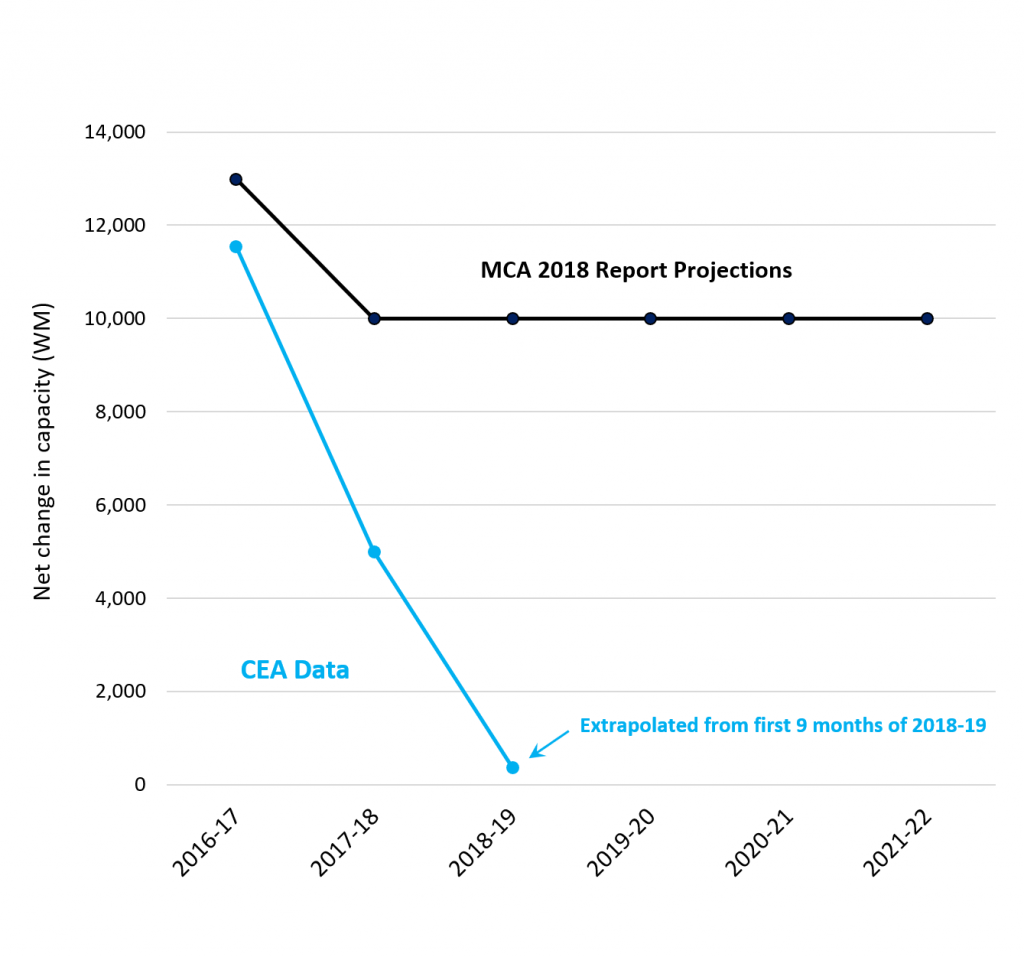
While this latter data may not play a clear part in the MCA report estimates, it should be noted that actual thermal capacity net increases2 have so far fallen well short of the report’s forecasts, as Figure 1 shows.
For the long-term outlook to 2030 (and evidently also short-term forecasts), the MCA report multiplies for a given year the forecast for India’s population (UN mid-range values) by that for electricity consumption per capita, with the product being that year’s forecast electricity demand.
The total coal requirement for each year is in turn estimated by using the ratio (for the base year of 2016) of coal’s share of electricity demand to total (domestic + imported) coal, with that ratio then applied to each year’s projected electricity demand. Further, the MCA estimate of the share of that demand met by coal is then determined as a proportion that declines by 0.5% per year to account for the increasing penetration of renewable generation.
To verify that this is a reasonable approximation of the method employed for the MCA report, IPR first replicated these calculations with the MCA’s published input data, leading to a very close agreement with their estimates. The average error was 3 Mt (range 1-10 Mt) of total coal used in each forecast year, representing an average 0.46% (0.035-1.09%) error. These are within or close to the expected limits for rounding errors and data reported (in some cases) to three significant figures. The long-term forecasts in particular were very close (3 Mt difference for 2026, 1 Mt difference for 2030), which verifies the calculation method and allows alternative input data to be tested in a way that is highly comparable.
Applying a more realistic rate of thermal coal’s share of generation
These calculations were then repeated using the same electricity demand forecasts, but a higher and more empirically justified rate of decline in thermal coal’s share of generation. The 0.5% per annum decline used in the MCA analysis is just over half the actual rate of 0.88% per annum over the last 42 months.3 With renewable generation increasing exponentially, using the 0.88% value as a linear decline rate for coal’s share of generation is quite conservative.
It is also a rate which does not require India to completely reach its 175 gigawatt (GW) renewable capacity goal for 2022, as calculated using current aggregate capacity factors for Indian wind and solar.4 For example, a 2022 solar capacity of 97GW and wind capacity of 57GW (compared to the respective 100GW and 60 GW targets) would meet the mid-range electricity demand projections in that year if coal’s generation share continued declining at that rate. (In all likelihood, additional capacity will be more efficient than the existing fleet average5, allowing these generation goals to be reached with a smaller installed capacity).
Figure 2: Alternative
Forecasts of India’s Future Thermal Coal Imports
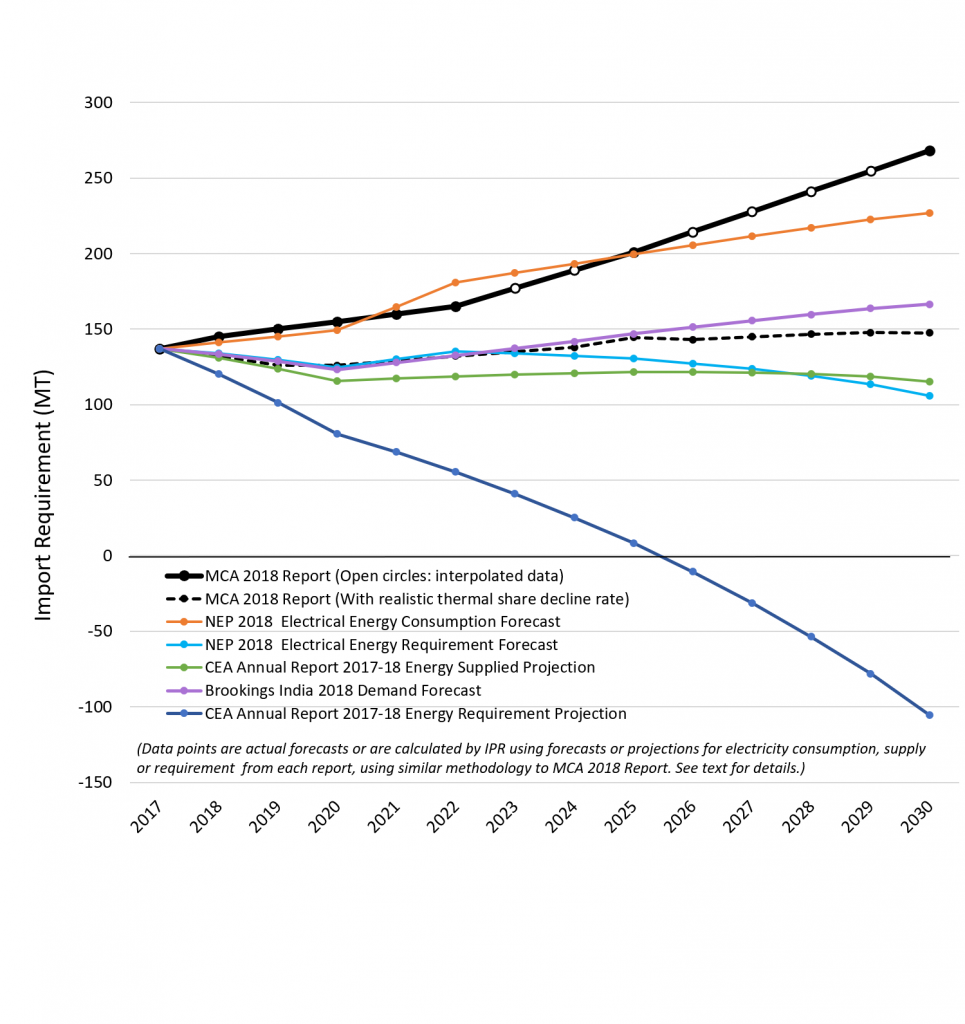
Altering this one assumption yields the dashed black curve in Figure 2, that is, a barely changing import requirement over the whole forecast period.
This illustrates the importance of using realistic values for coal’s future share of generation, as the MCA report’s apparently minor under-estimate of the decline rate inflates the estimate of India’s coal import requirement by three-quarters of a billion tons in the years to 2030 (the power of compounding).
Alternative estimates of electricity demand
The MCA report’s forecast demand values seem quite plausible on the surface, but in fact they build in a significant upward bias.
While the MCA report correctly states that consumption per head increased at about 5.8% per annum between 2008 and 2014, ‘energy not supplied’ fell from 11.1% to 3.6% over the same years.6 In addition to tracking increasing demand, generation (and therefore consumption) had to also make inroads into the energy deficit. Now that the country has virtually achieved a balance between demand and supply, only demand will need to be tracked. In addition, India’s notoriously high transmission and distribution (T&D) losses are forecast to decrease from 20.7% in 2016-17 to 14.9% in 2026-27.7 Even if this improvement is only partially achieved, it will further depress the ratio of generation increase to consumption increase. The end result is that consumption trends overestimate those for generation. Further, average coal plant efficiency continues to improve as end-of-life plants are closed, such that coal use per unit of electricity has been declining by 1% over the last five years. Both these factors reduce the overall demand for thermal coal relative to the MCA report’s forecast.
Given these factors, it is reasonable to substitute some alternative estimates of future electricity demand. IPR used four. Three of these are actual forecasts that take account of multiple factors, such as predicted economic growth in different sectors of the economy, energy efficiency changes, and new loads, while two are projections based only on recent actual trends. All are modelled with the MCA report’s methodology but using the more realistic decline rate for thermal generation.
What are these inputs and what results do they give?
- Electrical Energy Consumption Forecast. Taken from the Central Electricity Authority’s (CEA’s) 2018 Electricity Plan, this should be closest to the MCA forecasts given that it a consumption variable. The CEA expect a compound annual growth rate (CAGR) of 7.15% until 2021-22, and of 6.03% from then to 2026-27. (In our calculations, this second rate is extended to 2030). As expected, this input yields import results similar to those reported in the MCA study, though briefly higher for four years in the early 2020’s and tailing off in the out years (orange curve in Figure 2). By contrast it predicts uniformly higher values than the adjusted MCA report predictions using the more realistic assumption for coal’s future generation share, because the underlying growth rates are higher.
- Electrical Energy Requirement Forecast. Also taken from the CEA’s latest Electricity Plan, this variable takes account of the progressive reduction in T&D losses outlined above, and better indicates the resulting generation requirement. The CEA also anticipate a higher CAGR in this variable until 2022-23 (6.18%) than in the later years (5.51%). Predicted coal imports based on this variable, shown in light blue in Figure 2, start out very similar to the MCA report’s values adjusted for a more realistic thermal generation decline rate, but in the last seven years tail off markedly to about 100Mt, well below current values.
- Energy Supplied Projection. This variable, energy supplied to utilities, was obtained from the CEA Annual Report 2017-18and enabled a projection from recent actual data rather than a forecast. We calculated the CAGR of this variable between 2011-12 and 2017-18 and projected coal imports using that rate for the study period. These values appear in Figure 2 as the green curve. It predicts similar import requirements as the preceding Electrical Energy Requirement Forecast, though resulting in a flatter curve. It should be noted that linear and exponential fits to the last seven years’ data were virtually identical, making a simple linear extension of the CAGR appropriate.
- Brookings India 2018 Demand Forecast. This independent, bottom-up, end-user analysis8 considers many factors specific to different sectors while providing demand estimates for three rates of economic growth and three levels of energy efficiency. We use the mid-range growth scenario and mid-range efficiency level forecasts. The report focuses on demand but acknowledges that demand growth is likely to exceed generation growth because of falling T&D losses. The import requirements estimated from this report rise only modestly out to 2030, falling well short of the original MCA expectations.
- Energy Requirement Projection. Like its ‘Energy Supplied’ counterpart, also from the 2017-18 Annual Report of the CEA (number 3), this variable was taken as the last seven years of actual data, with the resulting CAGR then used in the import calculations. Again, an exponential fit was no better than a linear fit for these seven years, with no evidence of an upturn in the rate. This analysis resulted in the most clear-cut decline, reaching zero import requirements by the mid-2020s, directionally consistent with the zero target set by Indian Coal Minister Piyush Goyal back in 2017, and at least in theory, liberating more than 100Mt of Indian domestic coal for the export market by 2030.9
History of demand over-estimates in previous Electricity Plans
In evaluating these alternative data sources, it is useful to recognise that India’s periodic Electricity Power Surveys which inform the CEA’s Electricity Plans have a history of over-estimating future demand growth. While successive reports adjust the starting value downwards to better reflect reality, the over-estimates have continued for two decades, a pattern similar to over-estimation by global forecasters like the International Energy Agency (IEA), and in Australia by the Australian Energy Market Operator (AEMO).
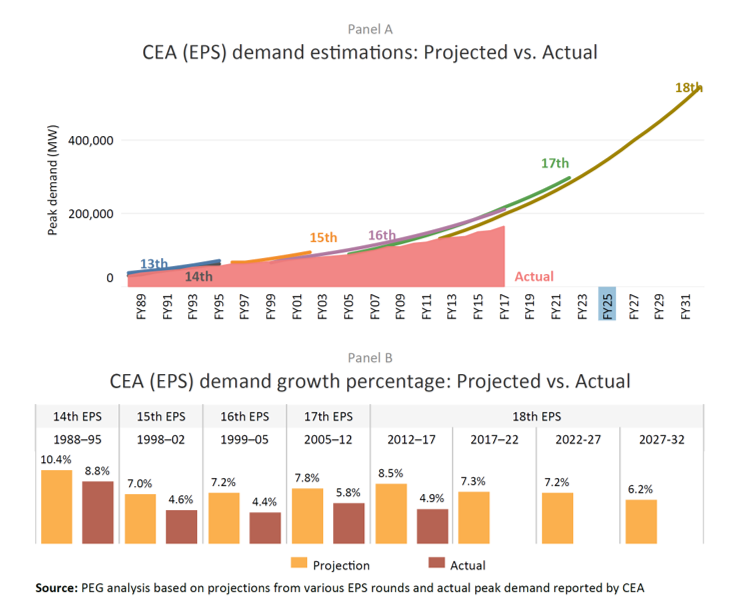
A 2017 analysis by a Prayas (Energy Group) team shows this history well.10 Reproduced from their report, Figure 3 depicts Electricity Plan forecasts for peak power demand, along with actual values. As this team states: “Evidence from over 20 years shows that actual demand growth has been much less and more or less consistent at about 5%. Yet, the assumed growth rates continue to be 20% to 30% higher at 7% to 8%.”
Therefore, even though the import curves presented in Figure 2 using CEA forecasts are ostensibly as realistic and accurate as can be expected, if history is a guide, they may depict an unrealistically high level of electricity demand growth and thus coal import requirements.
Figure 3. Prayas
(Energy Group) Comparison of Actual and Forecast Demand Estimations
Limitations and Strengths
Forecasting exercises of this kind are beset with uncertainties such as economic upheavals and policy changes or reversals. These may radically change the real-world situation. Even without such unpredictable events, the utility of these numerical forecasts can only be as good as the quality of their assumptions and input data.
They also have some specific, identifiable limitations. Some are related to the data sources (for example, the nominal base year of the MCA report is 2016), but differences between calendar and financial years creates some uncertainty about the proper allocation of data to years.
The predicted 2017 and 2018 import values could also benefit from offset adjustments as the actual values are now known, and 2018 imports are reported to have risen to 164Mt (Wood Mackenzie) or 172Mt (American Fuels and Natural Resources)11, an unsurprising temporary increase given that the growth in Indian domestic coal production had slowed to just over 2% in financial year 2017-18 (against the MCA projection of 6.5%), and has subsequently rebounded to a value closer to 7%. The CEA’s latest year-to-date coal import data shows only a modest 2.4% year-on-year rise12, so that large 2018 increase appears not to have been sustained.
To render comparisons easier, all data sets were assumed to start at the MCA value of 137Mt of thermal coal imports for 2017, with the appropriate rates of change then applied. In any event, the longer-term trends will not be significantly affected by different starting values.
More significant are some boundary condition assumptions. For example, as long as coastal Indian plants still require higher quality coal and/or remain unconnected by rail to domestic coal sources, it is unlikely that thermal coal imports will actually shrink to zero by 2030, absent major economic or policy changes, and multi-billion dollar stranded asset write-offs. The Government of India and State Bank of India have been exceptionally keen to avoid the latter13, even where the result is high tariffs uncompetitive for the long term. Import requirements also vary as the complement of domestic production, and although we used the same domestic coal production values as the MCA, the MCA values seem somewhat high in the initial years (thus reducing estimates of imports). However, a linear projection of recent domestic production ends up with a comparable 2030 value, so the patterns would not change substantially if higher values were substituted for those initial years.
These issues aside, a positive feature of these comparisons is that they all use the same calculation method which is also able to reproduce the forecasts in the MCA report. They differ in only one explicit and empirically supported assumption (the higher decline rate in coal’s share of generation), and in the input data. These alternative data sets are from respected, independent or government sources. Arguably, they represent measures of electricity demand that reflect thermal coal requirements as well as, or better than, the input data used in the MCA report. The comparisons made here between the various data-sets have greater validity as a result of employing the same calculation methods.
Conclusions
The widely differing import estimates derived from these alternative data sources emphasise the high level of uncertainty associated with such predictions. However, they also all concur that India’s future thermal coal import needs are probably much lower than the original MCA values. This is especially true for the out years.
Both the original MCA model and India’s National Electricity Plan Consumption Forecast contain structural biases that lead to overestimates of trends in generation, and hence of future coal requirements. A trajectory for imports somewhere amongst the lower five curves in Figure 2 would seem to represent a more reasonable projection.
While this will provide little comfort to any prospective exporters of thermal coal to India who are basing their expectations on the MCA report, it could also inform a more appropriate level of caution or scenario risk assessment in making longer-term investments and contract arrangements, and thus to a lower probability of stranded assets and unrepayable debt.
The MCA report identifies India as the
single largest growth market for thermal coal in coming years, but also
considers a total of eleven other countries. This analysis has no bearing on
the MCA report’s forecasts for any country other than India, but given the
divergence from those forecasts of the import trajectories for India shown
here, efforts to independently scrutinize those forecasts would also appear
worthwhile.
- Minerals Council of Australia, Market Demand Study: Australian Export Thermal Coal, Final Report, prepared by Commodity Insights, 13 June 2018
- We note that electricity sector capacity change is a function of the net increase in a given period, that being gross capacity additions less end-of-life plant closures. Optimistic forecasts often fail to take the inevitable nature of plant closures. For example, Australia has seen 12 coal plant closures in the last decade, and zero new additions. This policy issue has been compounded by a false assumption that coal plants last for an average of 50 years. In Australia, the average closure age is 41 years. In India, until very recently, the plant engineering design life is much shorter, at 25 years.
- Based on India’s Central Electricity Authority’s (CEA) monthly generation data for conventional and renewable sources, June 2015-November 2018.
- These aggregate capacity factors were calculated as total generation for each source for the most recent 12-month period (December 2017-November 2018) divided by the average installed capacity for that period using data from the Central Electricity Authority’s (CEA’s) monthly reports. These factors were 18.6% (wind), 15.5% (solar), 16.2% (bagasse) and 20.2% (small hydro). Calculations assumed a 10% share for hydro and 3% for nuclear generation in 2022.
- For example, new Indian wind projects being commissioned in 2018-19 are 30-50% taller and hence have much larger turbine lengths, supporting an average 30-32% utilisation rate estimate assumed by the proponents, 50% higher than the 20% average utilisation reported from wind in 2017-18.
- Government of India, Ministry of Power, Central Electricity Authority Annual Report 2017-18, 4 October 2018.
- Central Electricity Authority, National Electricity Plan Volume 1: Generation, January 2018.
- Sahil Ali, The future of Indian electricity demand: How much, by whom, and under what conditions? Brookings India, October 2018.
- The idea of India becoming a thermal coal export country has been canvased by Coal India as well as by NTPC with respect to building a rail connection for their planned Rampal import coal fired power plant in Bangladesh, but we note the very high ash content and low energy content probably precludes this in reality.
- Ann Josey, Manabika Mandal, Shantanu Dixit, The Price of Plenty:Insights from ‘surplus’ power in Indian States. Prayas (Energy Group), March 2018.
- Reuters, CORRECTED-UPDATE 1-India’s 2018 thermal coal imports grew at fastest pace in 4 yrs – sources, Jan 26, 2019.
- Central Electricity Authority. Monthly Report of Import of Coal, December 2018.
- Gujarat govt’s panel may bring Rs 1.29 bn relief to Tata, Adani and Essar, Business Standard, 11 October 2018.
Be the first to comment