

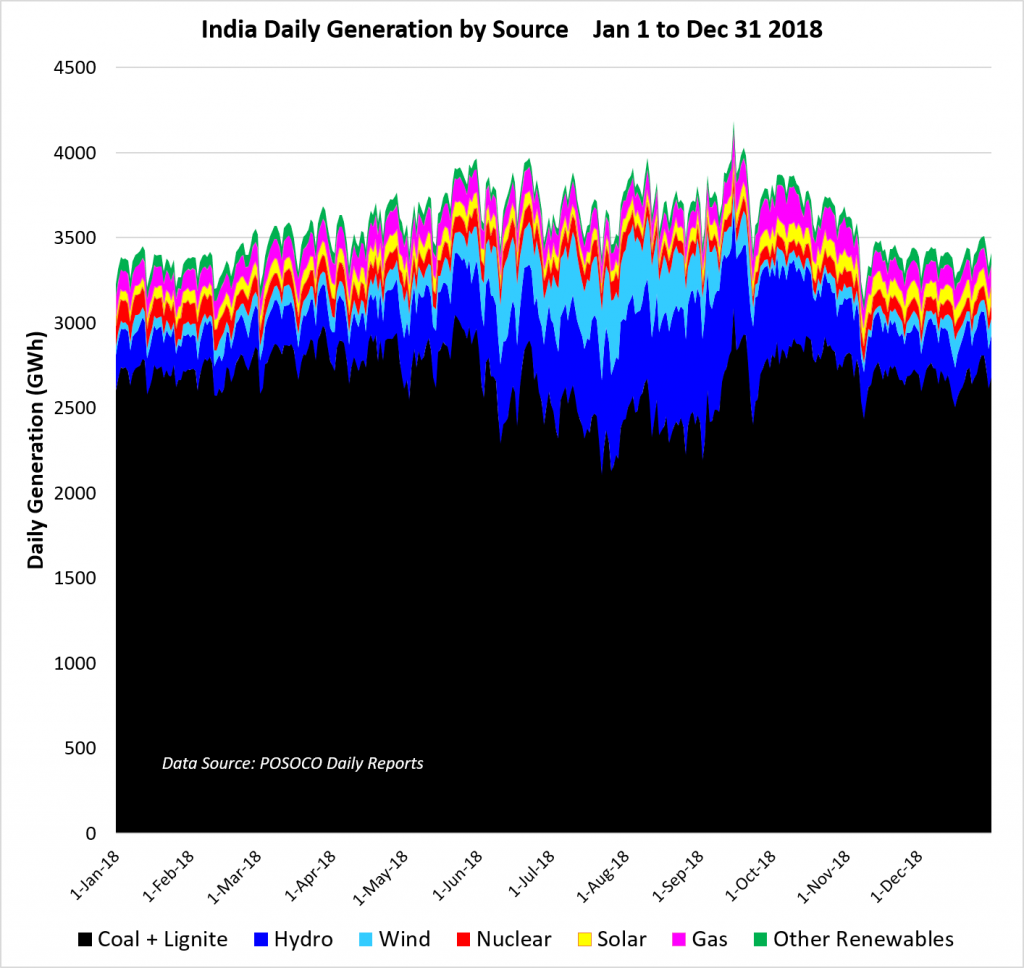
As flagged previously, January sees a regular monthly update in a pair of posts on coal and power. First, the whole of calendar 2018’s generation by source, showing levels at the end of the year only slightly higher than in January.
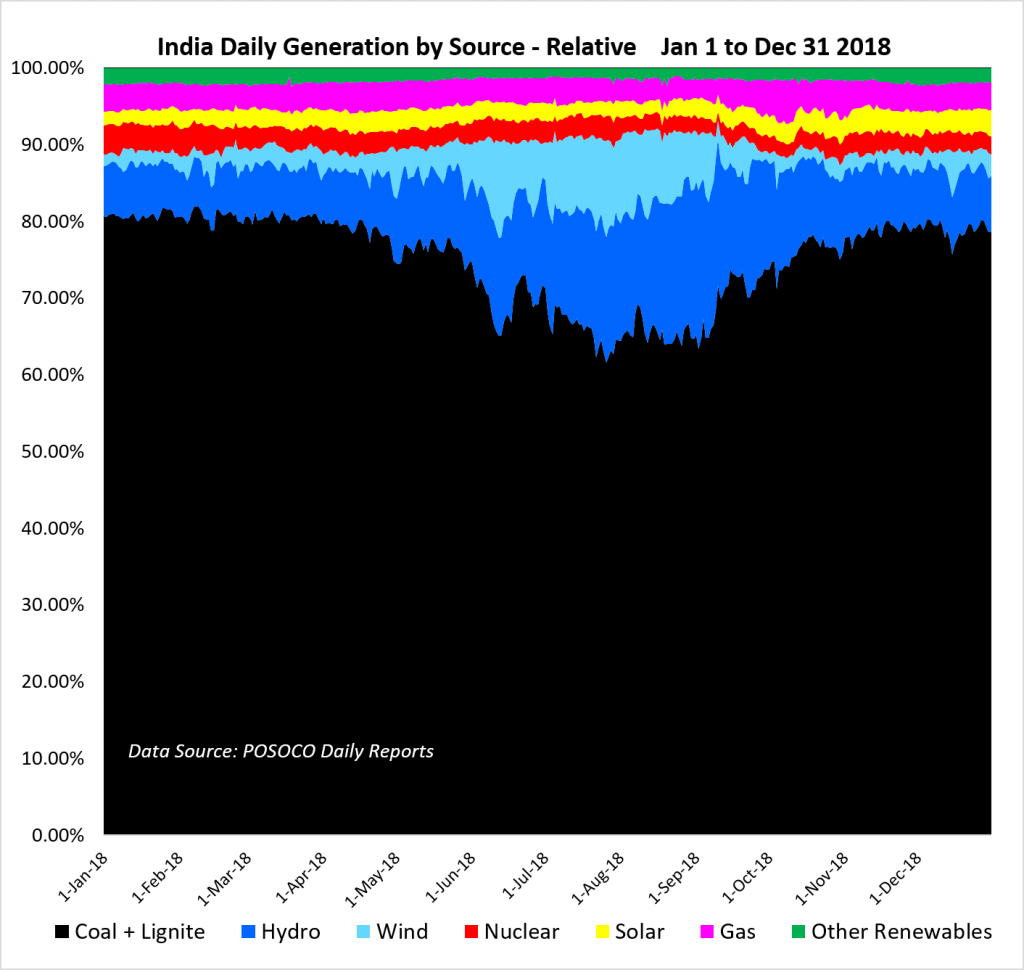
In relative terms, thermal power ended up slightly below where it began the year at about 80% of India’s generated grid power.
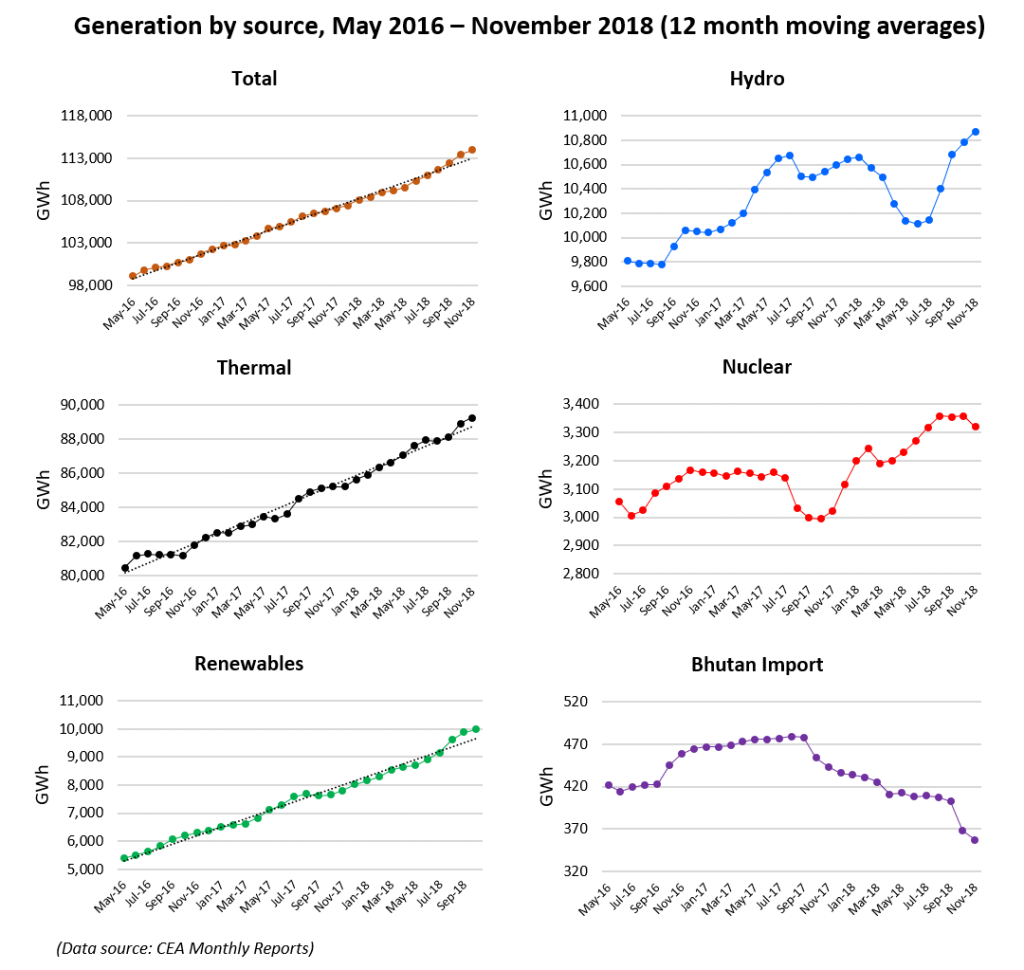
These individual graphs – both absolute and moving averages, are repeated from last month’s post as there have not been further CEA updates. We anticipate each month incrementing all graphs from this point.
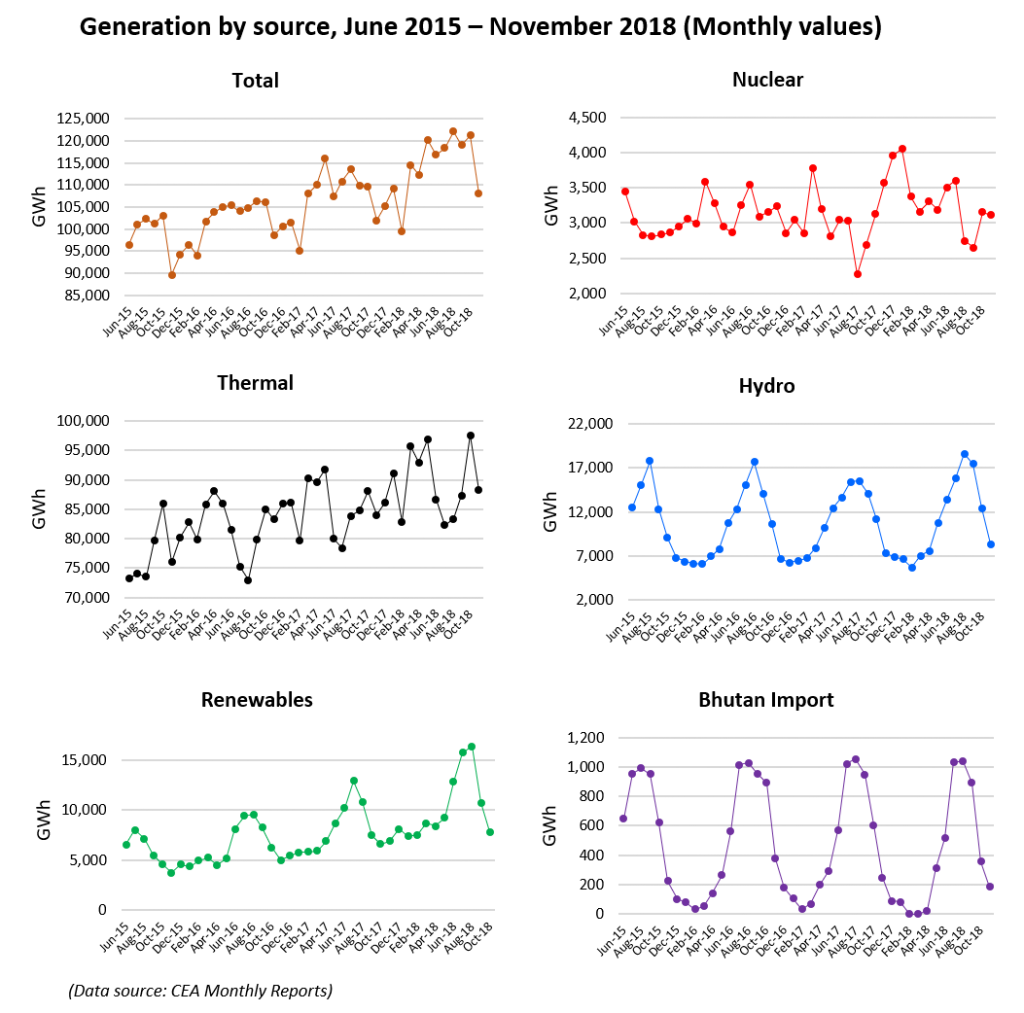
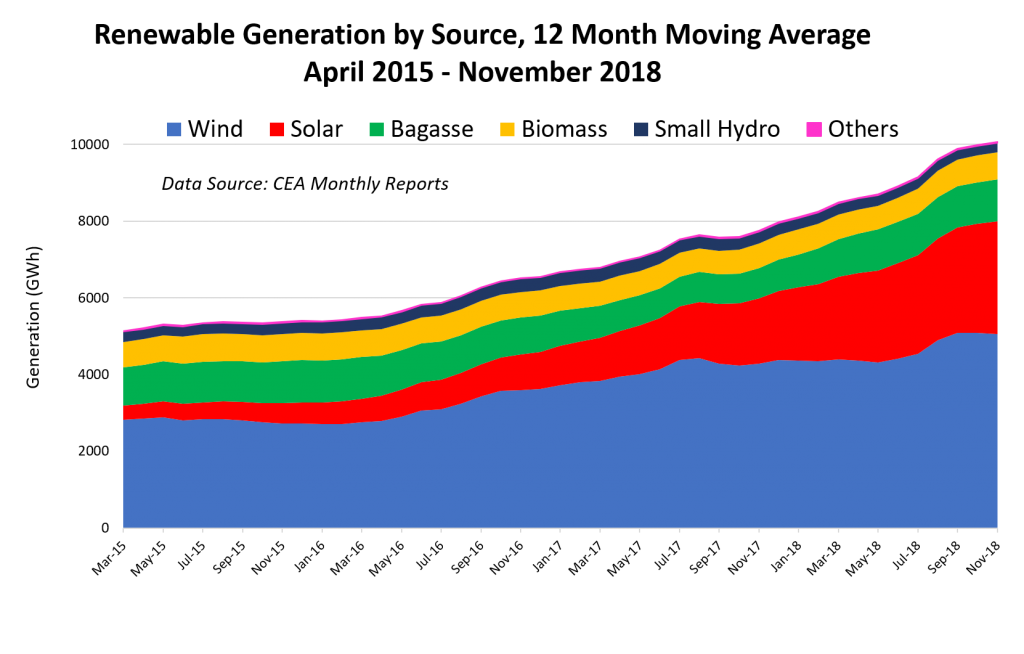
Renewable generation data has been updated, however, to November (it continues to lag ‘conventional’ generation statistics in the CEA series).
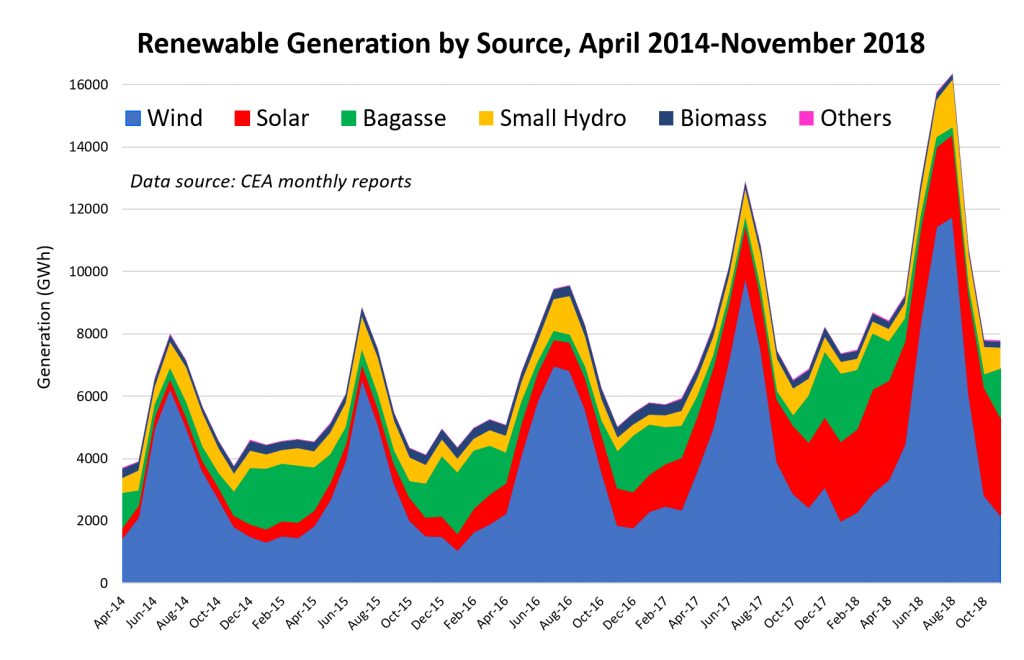
For the first time, November saw total renewable generation exceed 10,000 GWh as solar and wind continue their growth.
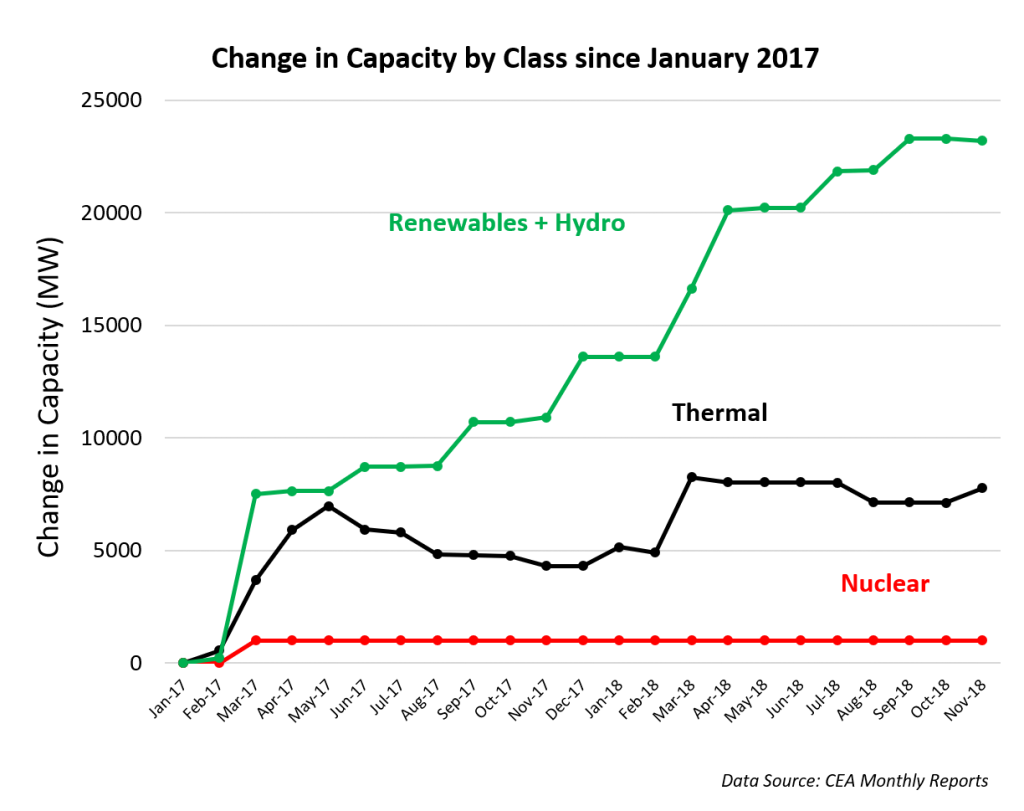
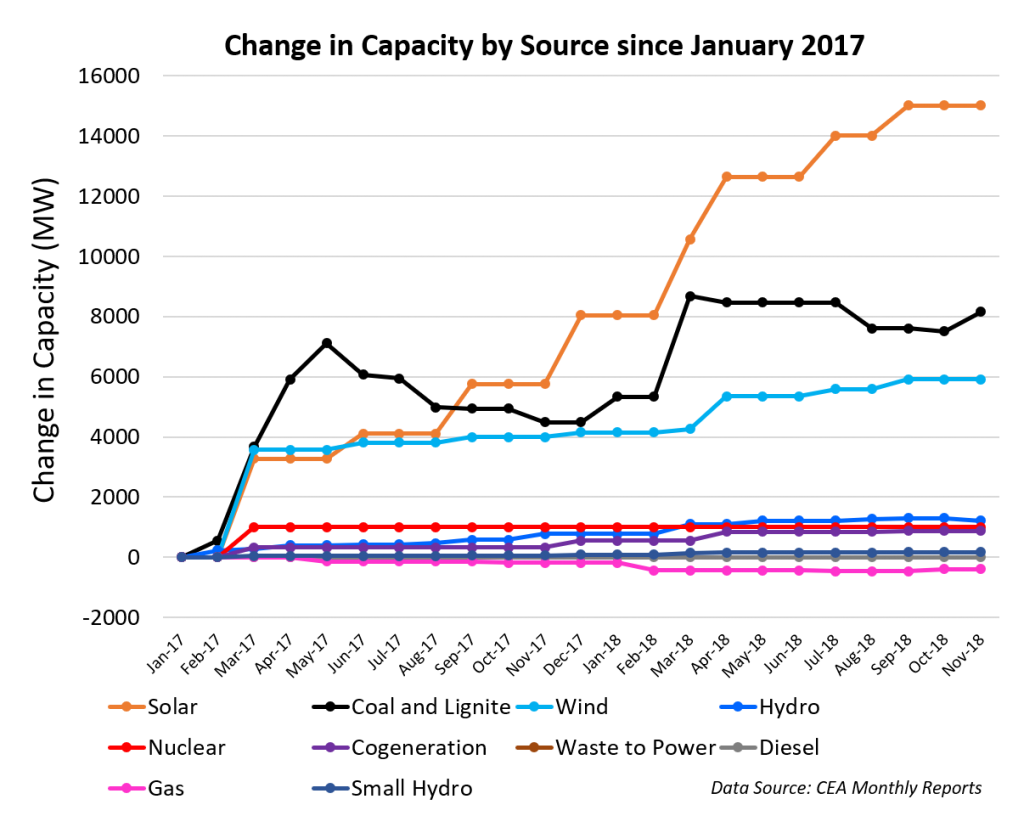
Again, there have not been updates to installed capacity since the previous post, so for completeness the graphs showing data up to November are repeated, and we expect them also to increment each month from this point.
Be the first to comment