
As promised, 2019 sees a regular post with monthly updates in the first week of the month.
To avoid confusion, the post title will from this point be labelled with the month the update is published, using the latest available data, which will often be for the previous month.
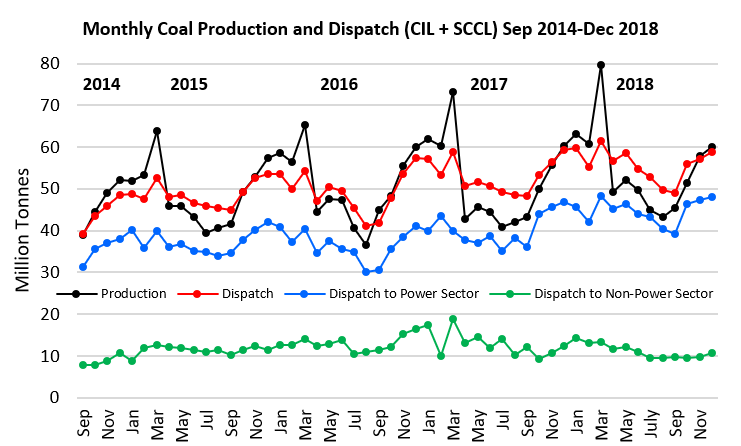
Coal production edged up in December, as did dispatch.
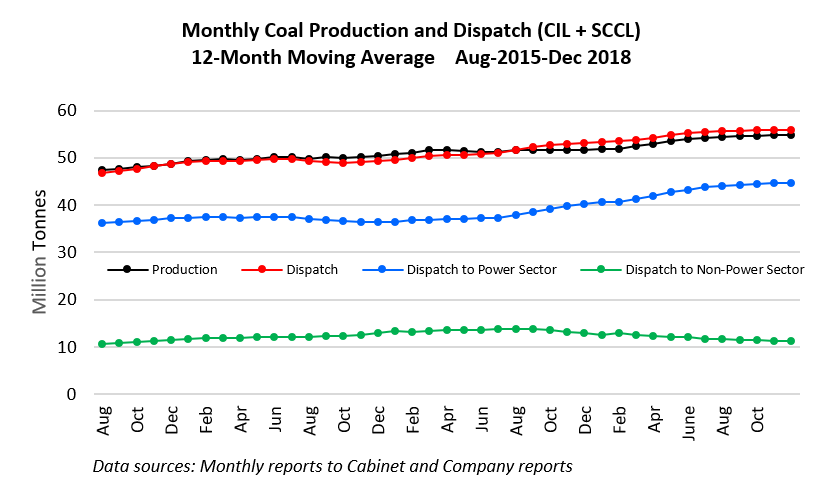
In the moving average series, the year-long increase in the quantum dispatched to power plants is beginning to plateau, which may allow more to be delivered to other sectors.
Because this month’s post is a little less than one full month after the previous one, not all monthly data has been updated. For completeness, however, we repeat the latest monthly coal consumption by power plants (absolute and moving average). From this point, all graphs should increment each month.


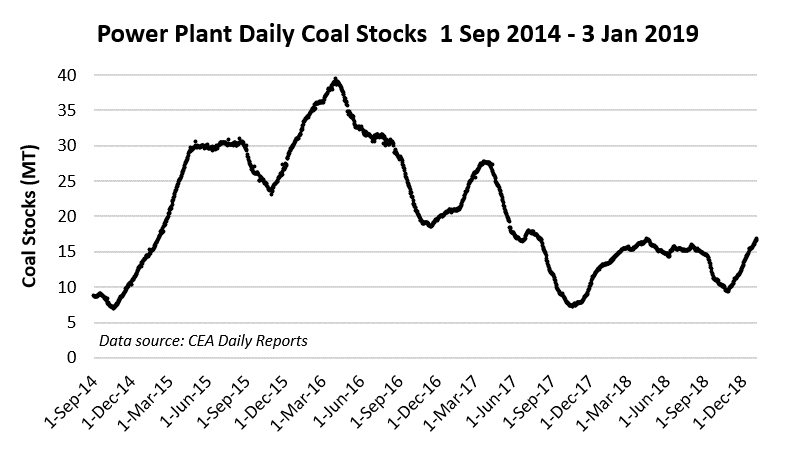
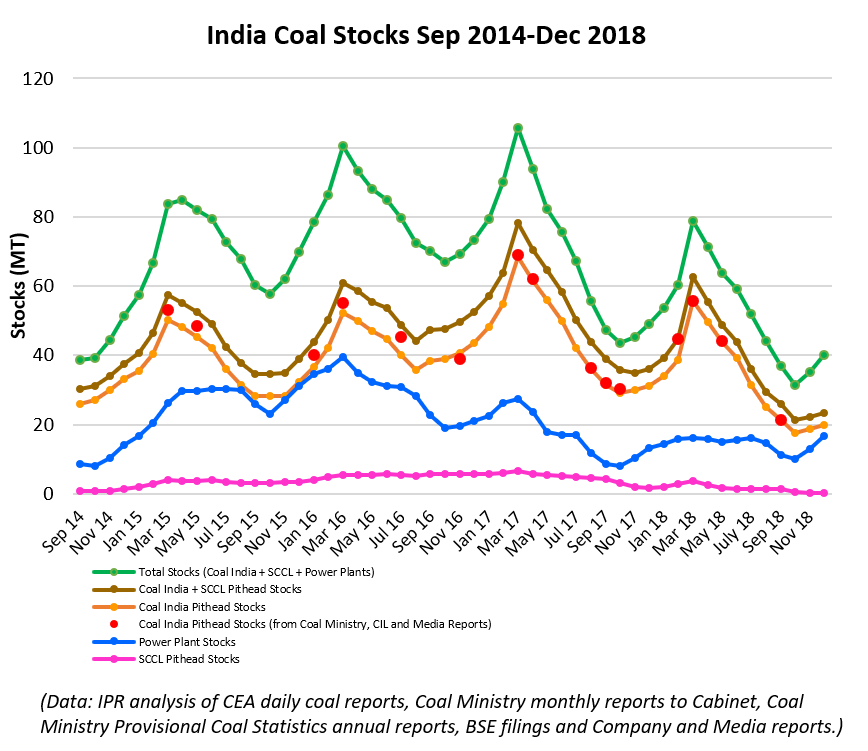
Power plant stocks have continued to move up, passing through the 16 million tonnes mark and reaching 16.8 MT as of January 3rd, the highest level for 18 months.
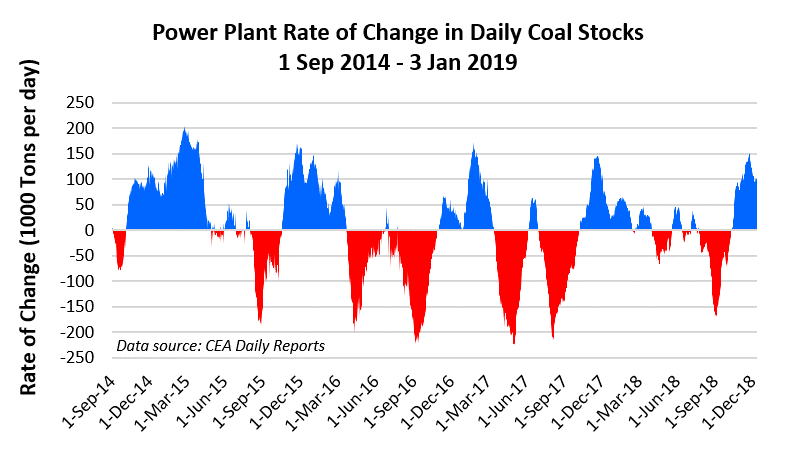
The rate of change of coal stocks (smoothed with a 21 day moving average) shows that the peak (so far) in the annual re-stocking rate reached a value similar to the last three years, but that it may be holding up at a higher level (adding about 100,000 tonnes per day) for a little longer than in the last two years – note the broader blue peak at the right end of the graph.
This month’s overview sees coal stocks rising at CIL pitheads, level at SCCL pitheads and up at power plants. As a result, total coal stocks are also on the way up, surpassing 40MT.

Be the first to comment