

Both of this month’s updates are late – the result of some fact-finding in India this past month. (Note: The first 4 graphs have been updated on 30/3/2019 to reflect the latest CEA renewable generation data).
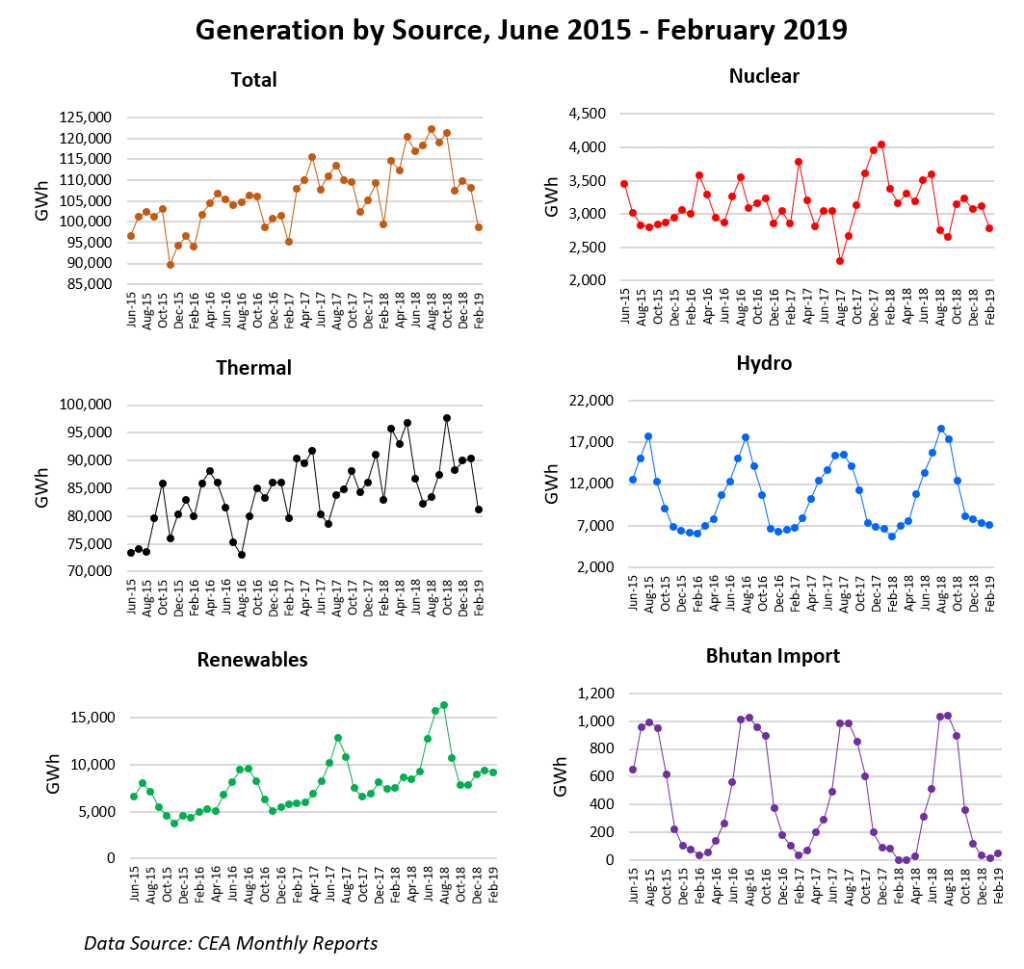
In January and February, overall electricity generation was subdued. Slightly less power came from coal and lignite than in the corresponding 2018 months, in contrast to the large increase seen last October. Renewable generation was steady, and nuclear generation is down from a year ago. Hydro generation is reaching its annual minimum marginally higher than in recent years.
Twelve-month moving averages show the recent slowdown in generation growth quite clearly. Preliminary data (not shown) suggests that March will have seen some increase from this plateau, however.
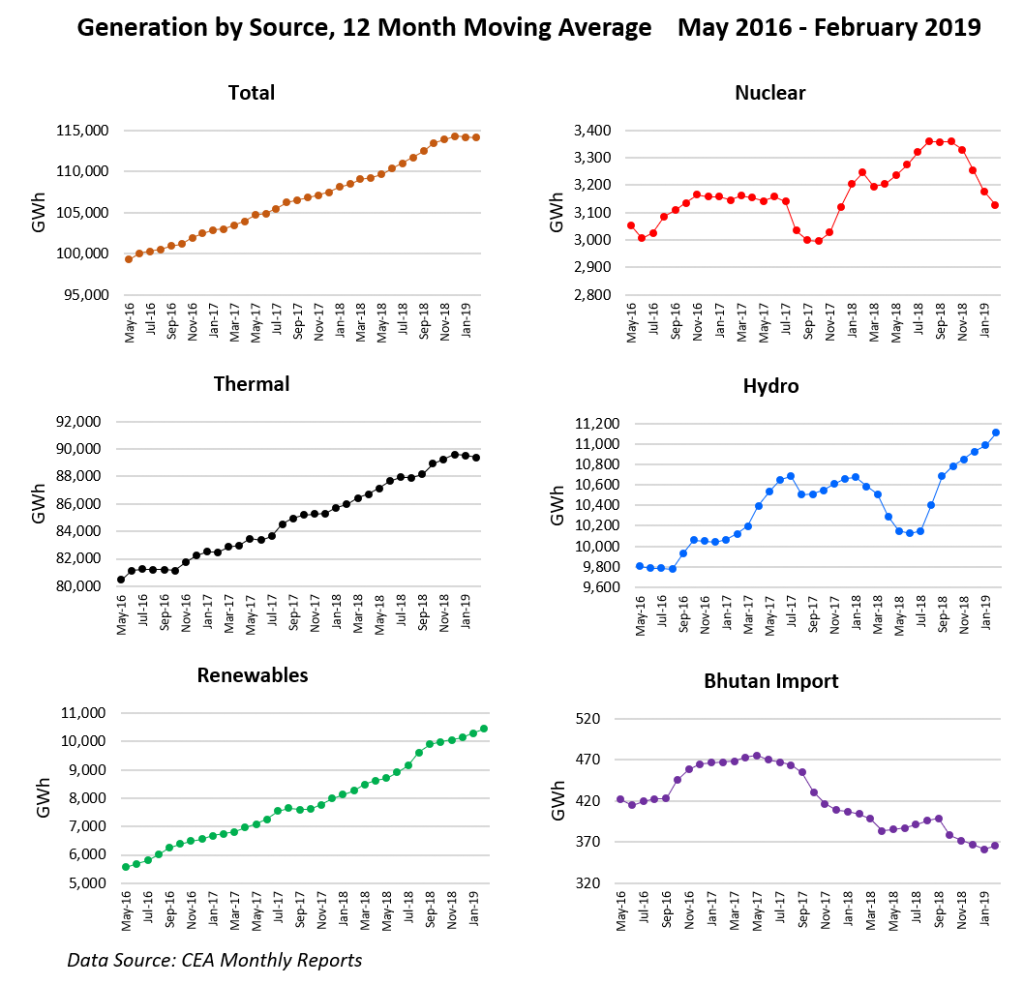
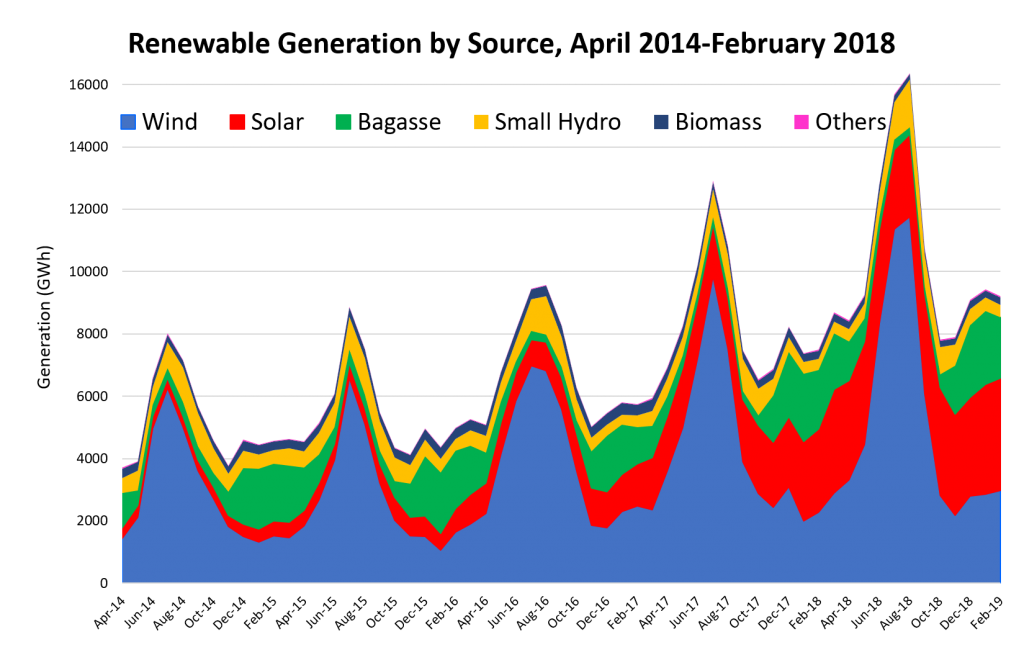
The now familiar increase in solar generation as the driver of renewable’s share is apparent in both the monthly and twelve-month moving average data, below. The round number milestone of 10,000 GWh of renewable energy each month (or slightly under 10% of total grid power) on an annual average basis, appears to be well and truly surpassed. Hydro and renewables together now account for roughly 18.5% of India’s total grid power each year.

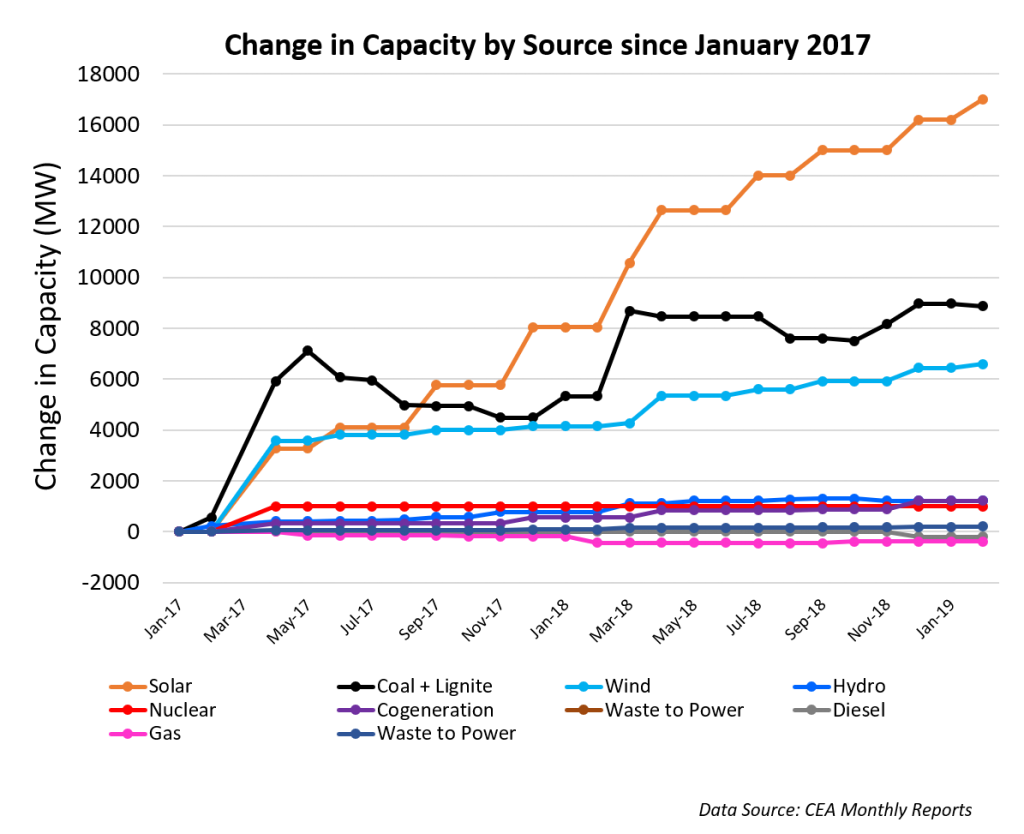
Net changes in installed capacity continue to show coal thermal capacity, principally coal and lignite, to be virtually unchanged for the last year, while renewable capacity continues to increase.
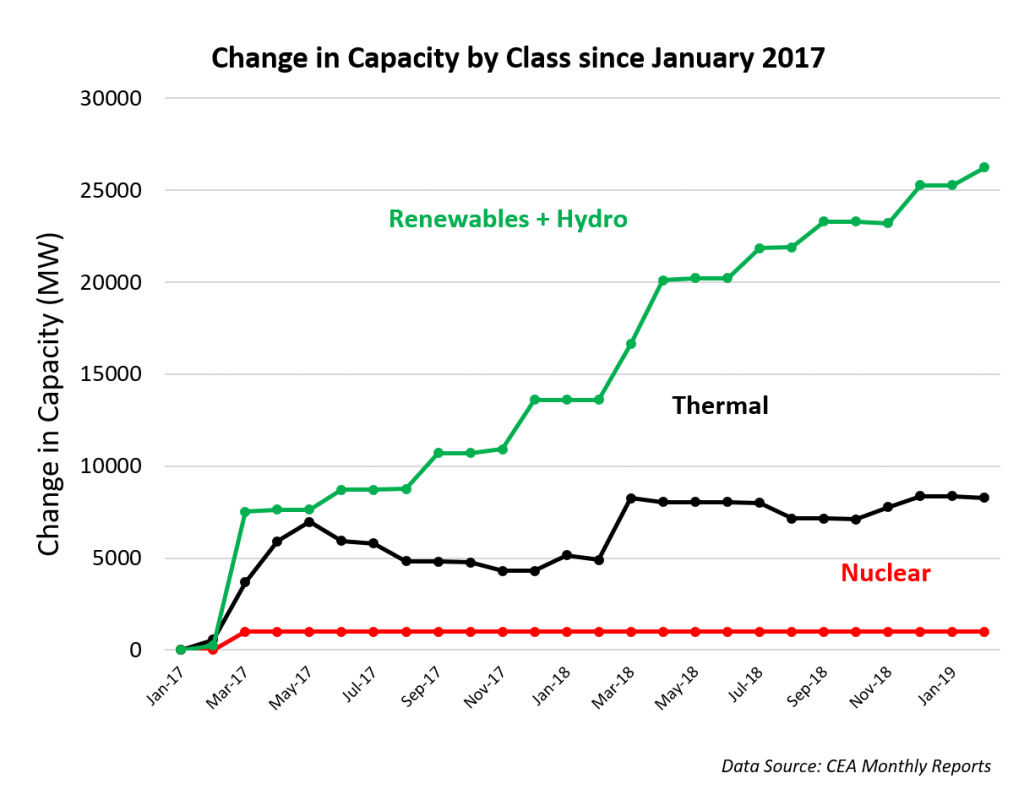
Within the renewable category, solar capacity is outpacing wind capacity growth by more than 2:1.
Be the first to comment