

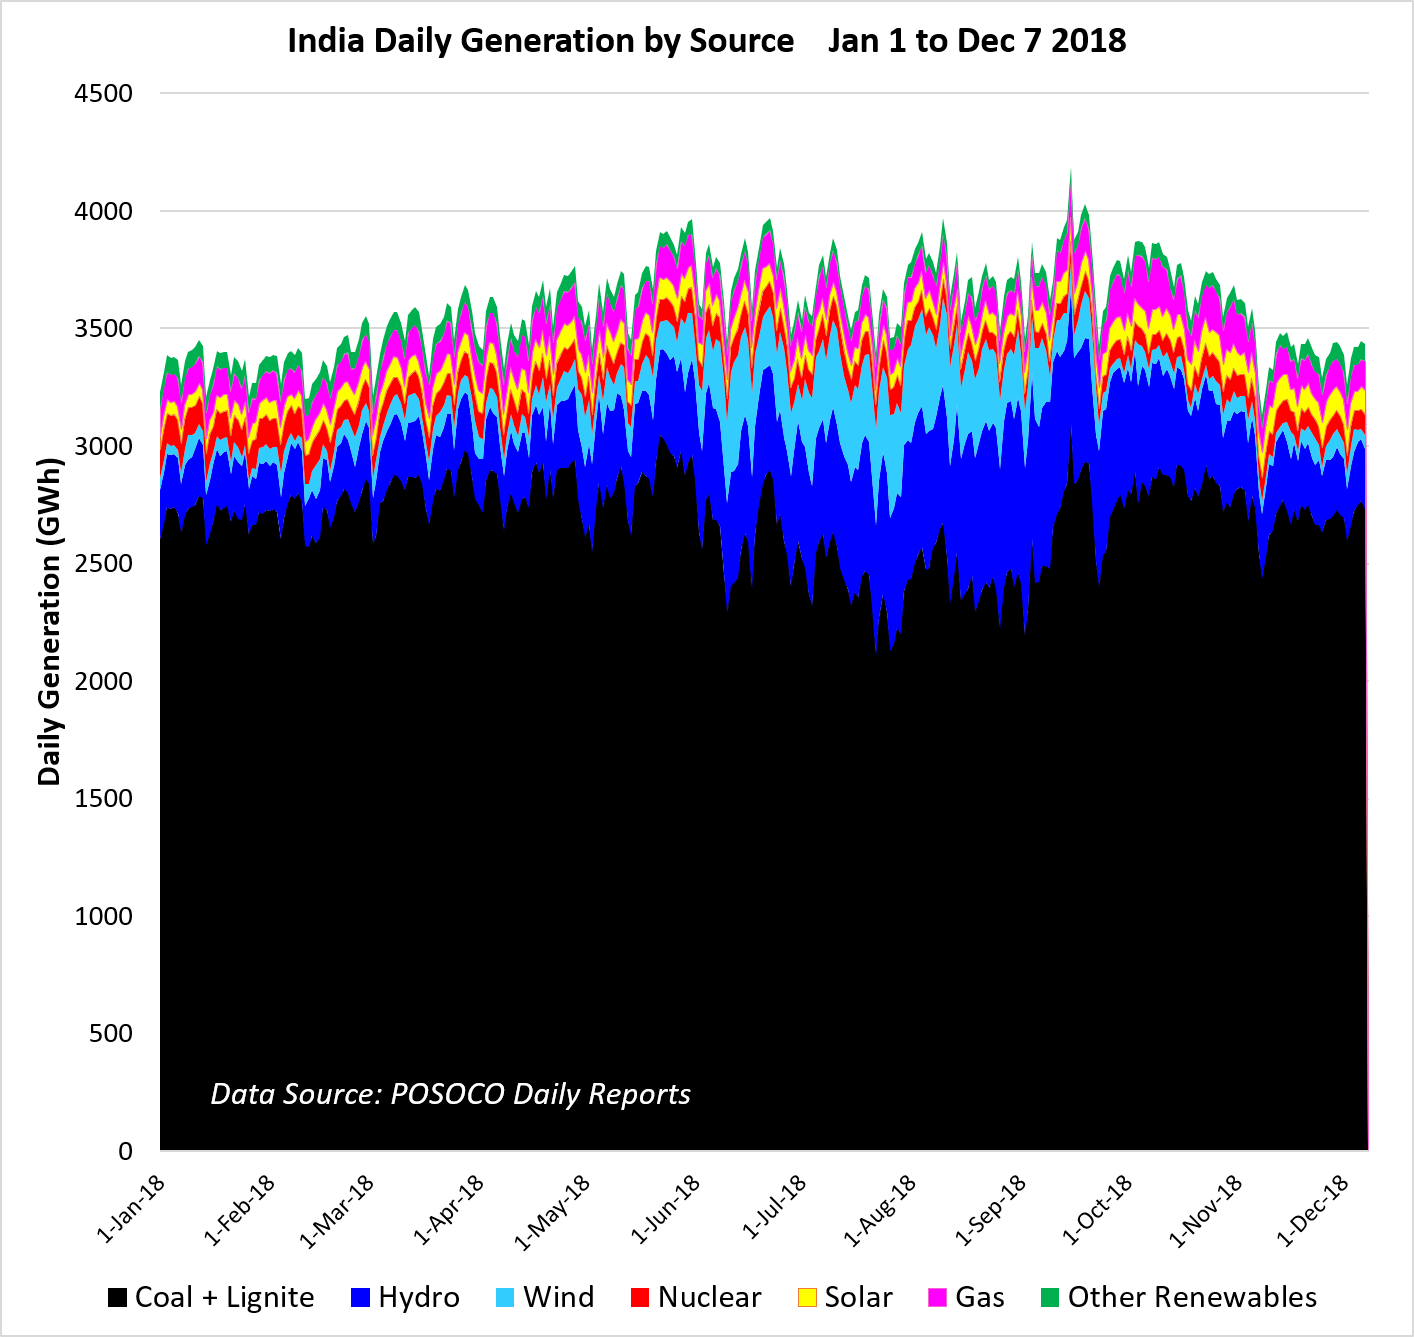
As mentioned in the next post, this month sees all the generation data updated together, once each month. Watch out for these updates in the first week of every month, commencing in January. We start with daily generation up to December 7th. The post-monsoon period has seen generation back to levels very similar to those for the beginning of the year:
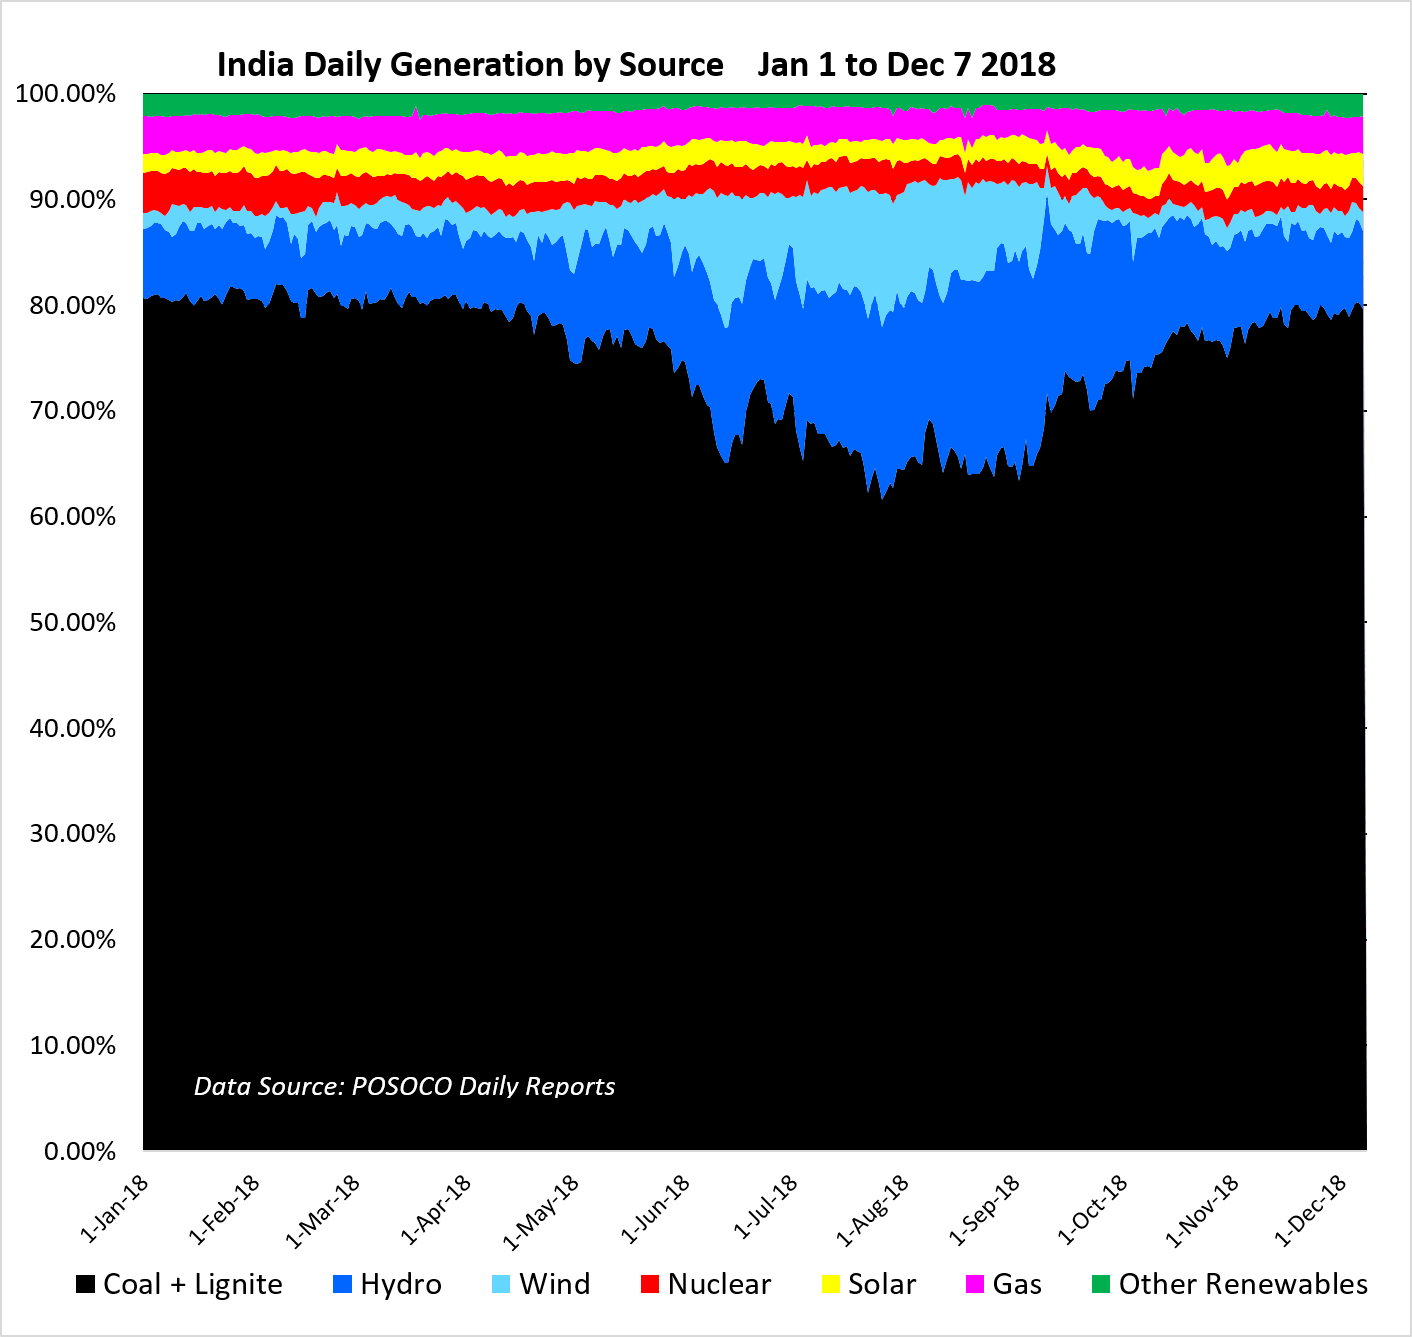
The same daily data shown in relative terms shows thermal generation back at about 80% of total generation, and the only other obvious trend is the larger solar output towards the end of the year offsetting one of the periodic decreases in the relative contribution of India’s nuclear plants:
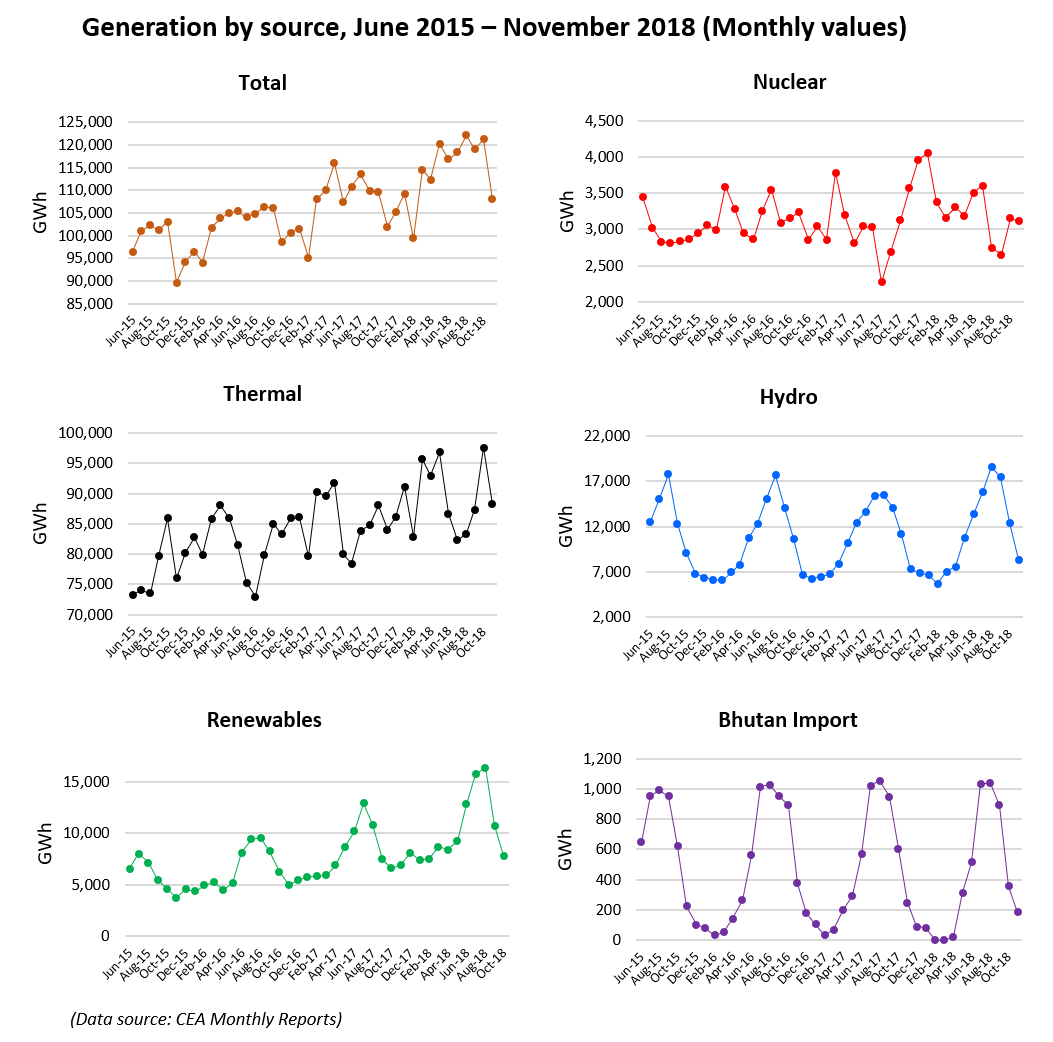
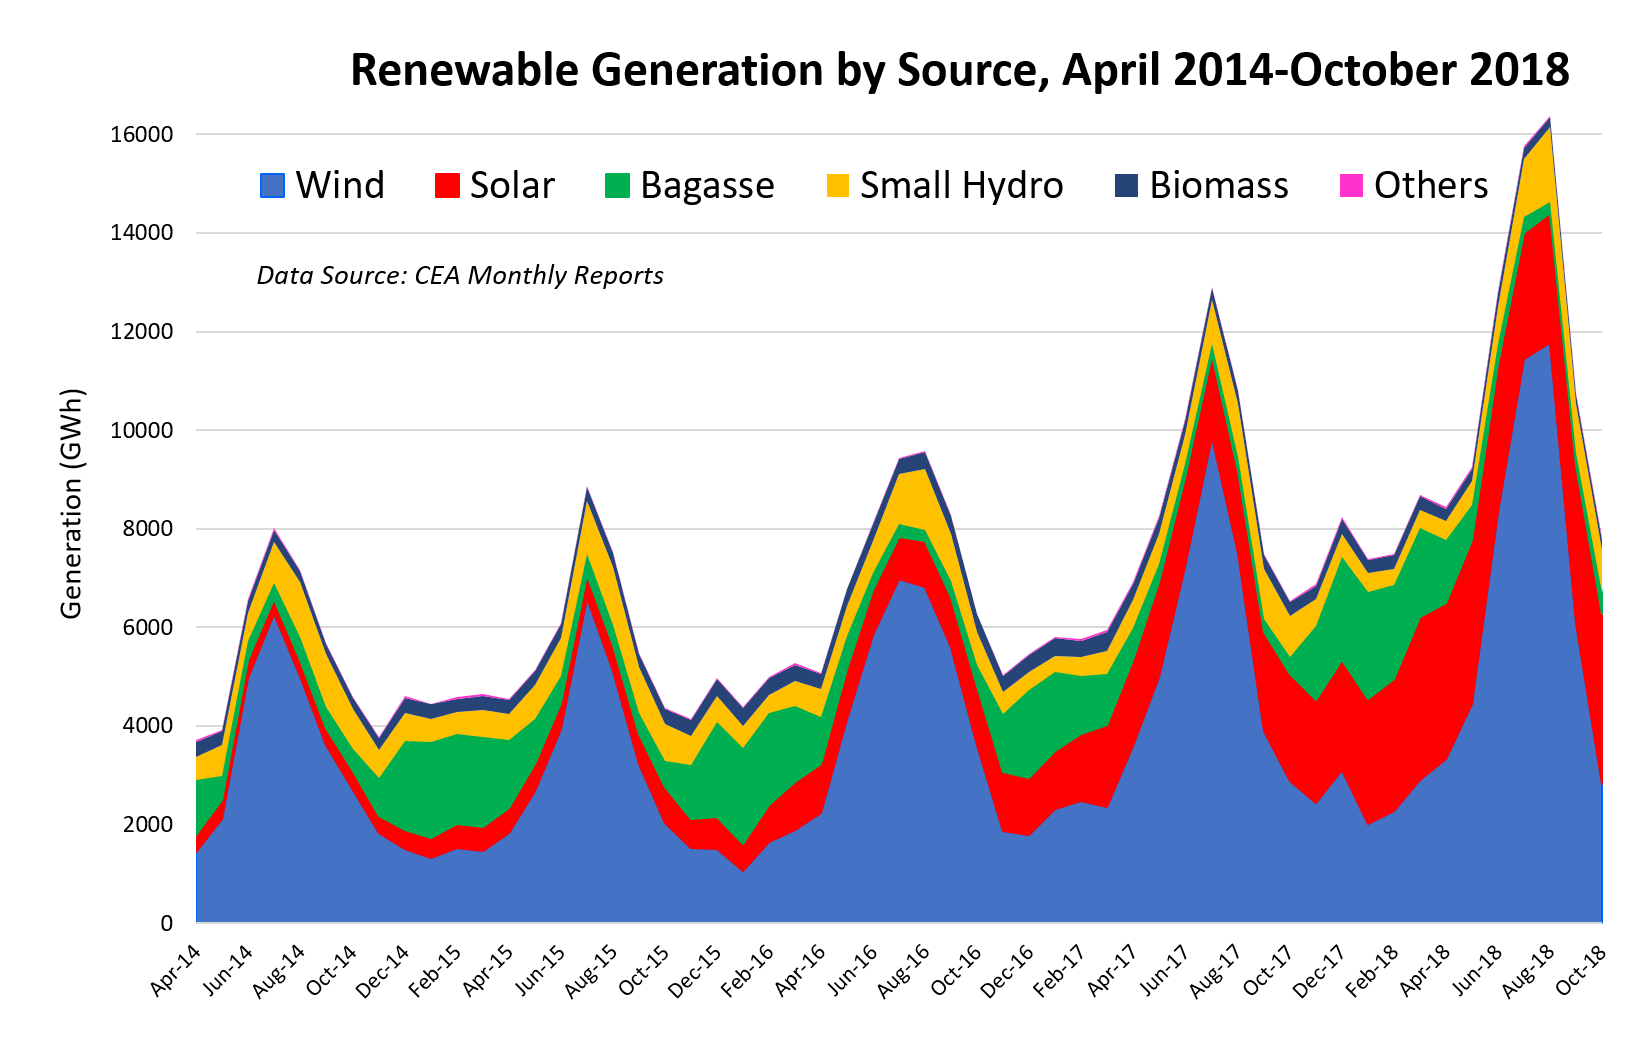
And now by source as separate plots:
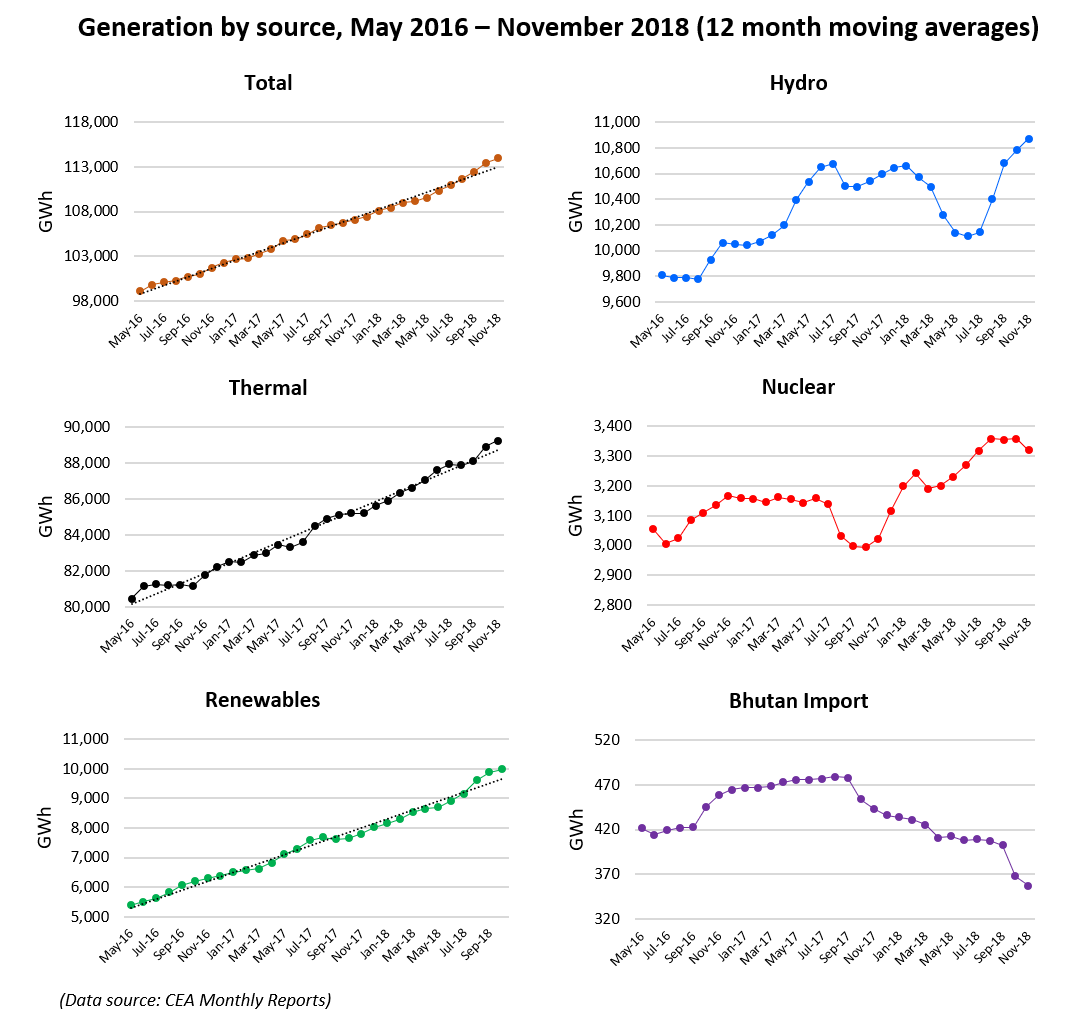
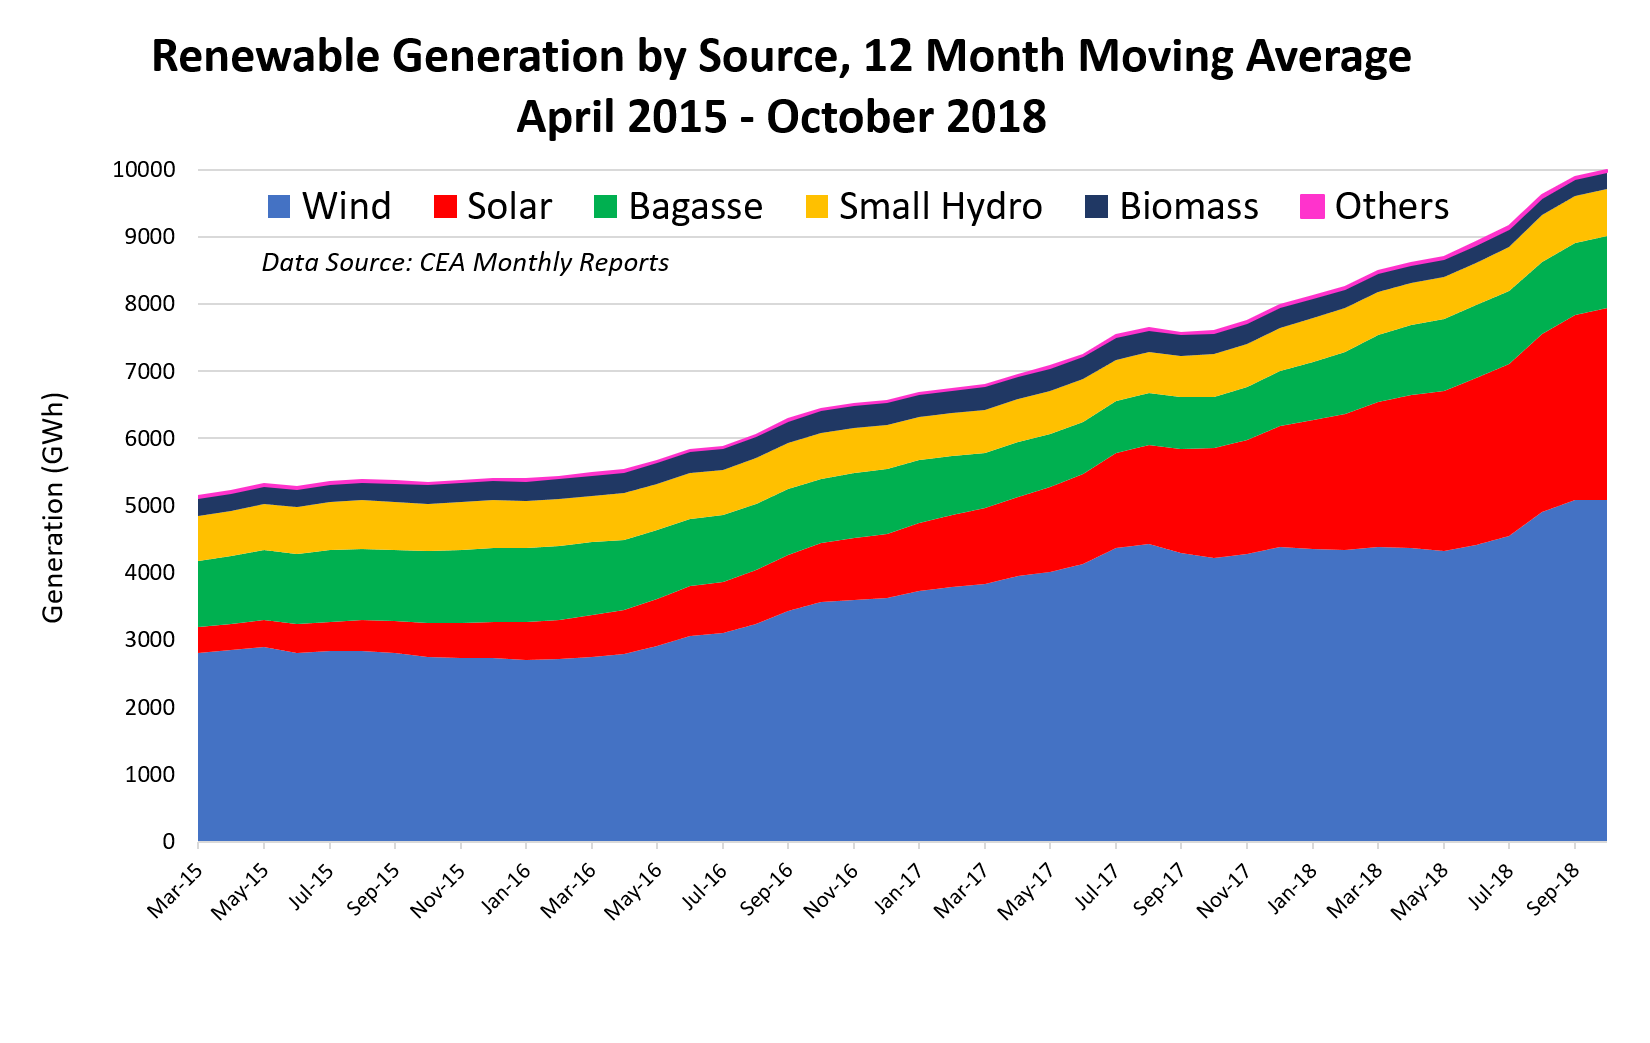
And, as usual, the same data expressed as a twelve-month moving average to remove the seasonal influences:
Renewable generation nears its seasonal low even as solar continues its upward march as a key renewable source of grid power:
Given the especially seasonal nature of wind, solar, hydro and bagasse, the twelve-month averaging renders the trends much clearer:
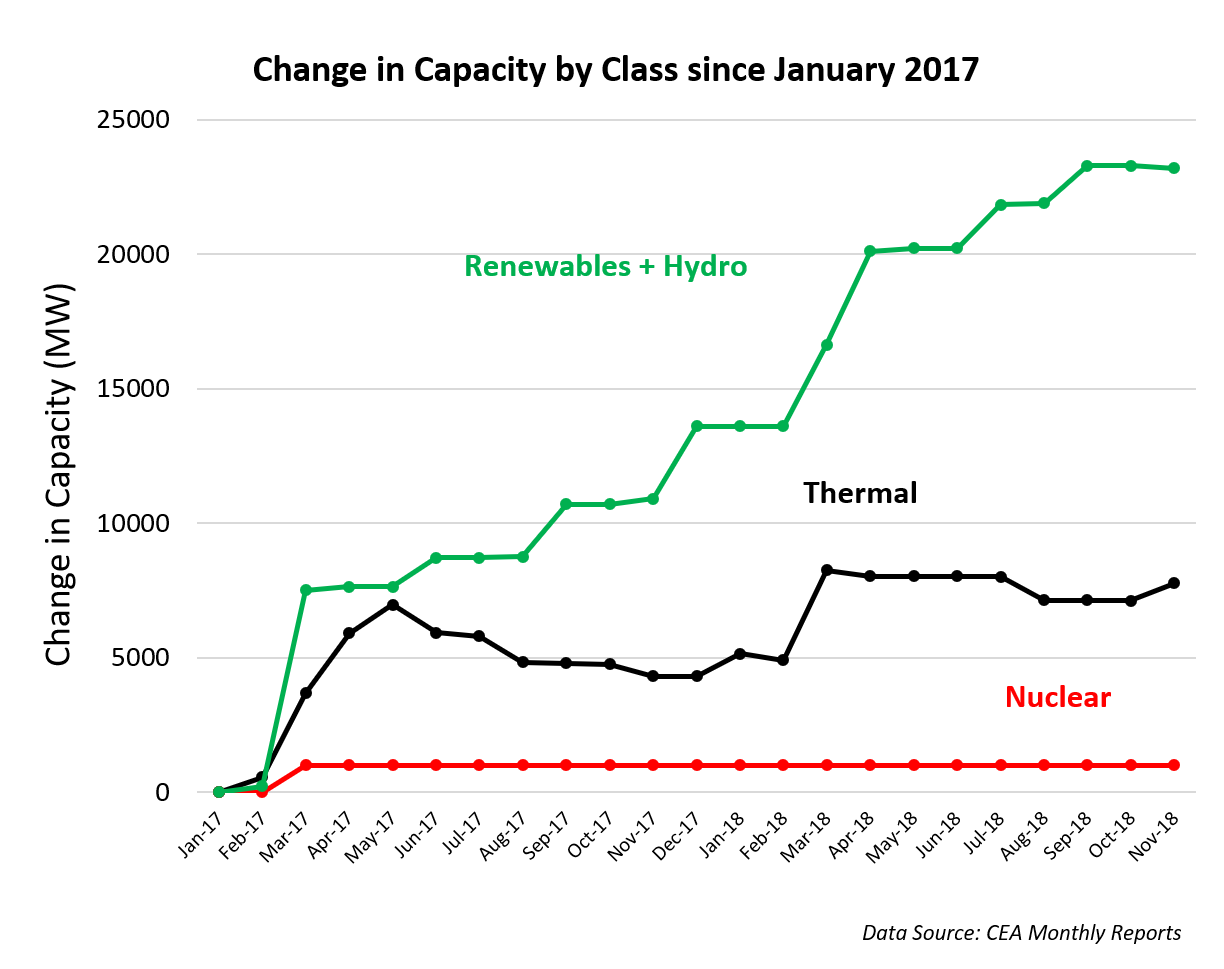
A new feature this month (which will be updated each month) is a depiction of generation capacity addition, using January 2017 as a reference date (i.e. setting all values to zero for that month). Some change values are negative, as various coal, diesel and gas plants are retired, as was Delhi’s notoriously dirty Bardapur coal plant recently, but the net changes are shown here, first by broad generation class:
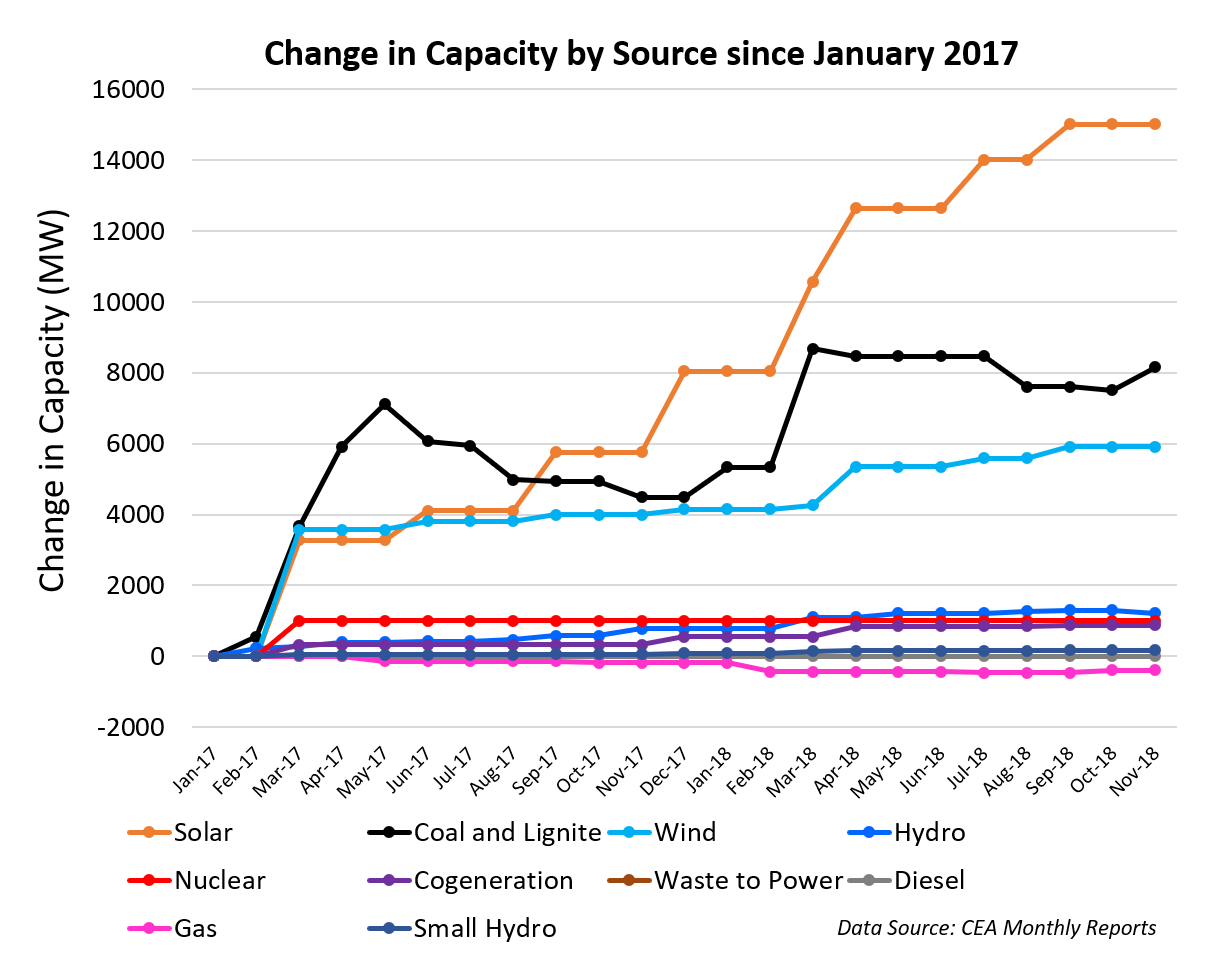
And next in a more fine-grained way, by source (though we have not followed the CEA’s recent separation of coal and lignite data – coal capacity dominates):
Be the first to comment